5.1 Structure of a Candlestick
Lesson Objective
Understand the anatomy of a candlestick and how to read the story of buyers vs sellers in each candle.
The candlestick is the fundamental building block of price action analysis in financial markets. Developed in 18th century Japan by rice trader Munehisa Homma, candlestick charts have become the universal language for technical analysis due to their visual clarity and rich information density. Each candlestick tells a story of the battle between buyers and sellers during a specific timeframe.
I. The Anatomy of a Candlestick
A candlestick consists of four key price points and two main components that reveal market sentiment and trading dynamics:
Four Price Points:
- Open: The price at which the period begins
- Close: The price at which the period ends
- High: The highest price reached during the period
- Low: The lowest price reached during the period
Two Main Components:
- The Body (Real Body): Rectangular area between open and close
- The Wicks/Shadows: Thin lines above and below the body
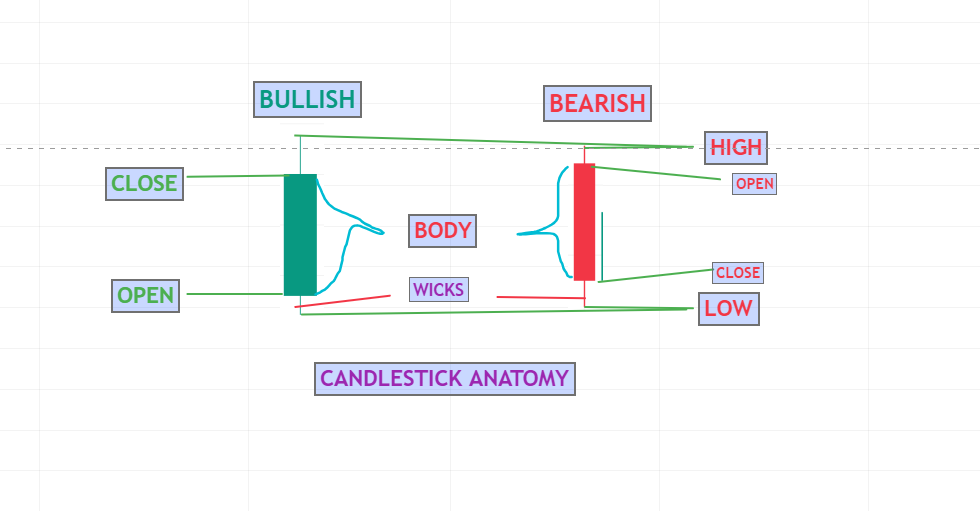
II. Body Interpretation: Bullish vs Bearish
Bullish Candle (Green/White)
- Close > Open
- Shows buying pressure dominated the period
- Longer body = stronger buying conviction
- Often called "up candle" or "white candle"
Psychology:
Bulls were in control, willing to pay higher prices to accumulate
Bearish Candle (Red/Black)
- Close < Open
- Shows selling pressure dominated the period
- Longer body = stronger selling conviction
- Often called "down candle" or "black candle"
Psychology:
Bears were in control, willing to sell at lower prices to exit
III. Wicks/Shadows: The Story of Rejection
Upper Wick/Shadow
- Shows distance between high and higher of open/close
- Represents rejection at higher prices
- Long upper wick = strong selling pressure after attempted rally
- Bullish candle with long upper wick: Bulls won but faced resistance
Lower Wick/Shadow
- Shows distance between low and lower of open/close
- Represents rejection at lower prices
- Long lower wick = strong buying pressure after attempted decline
- Bearish candle with long lower wick: Bears won but faced support
IV. Body-to-Wick Ratio Analysis
| Ratio Type | Visual Description | Market Interpretation |
|---|---|---|
| Dominant Body | Long body, small/no wicks | Strong directional control, conviction |
| Balanced Wicks | Small body, long equal wicks | High volatility with indecision |
| Long Upper Wick | Small body, long upper wick only | Strong rejection at highs (bearish) |
| Long Lower Wick | Small body, long lower wick only | Strong rejection at lows (bullish) |
| No Wicks | Body only (Marubozu) | Extreme conviction, no opposition |
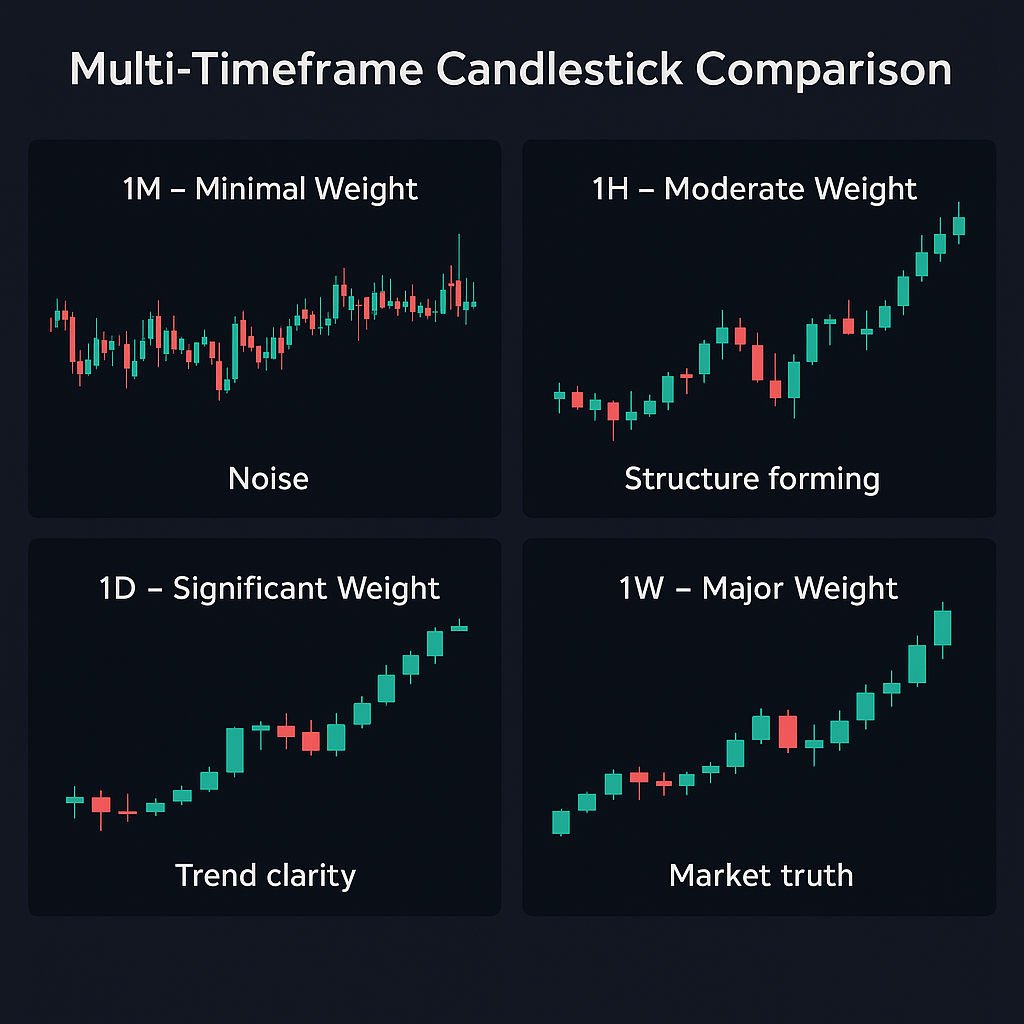
V. Timeframe Context is Crucial
Weight of Candlesticks by Timeframe:
- 1-minute candle: Represents 60 seconds of trading → Minimal weight
- 1-hour candle: Represents 60 minutes of trading → Moderate weight
- Daily candle: Represents 24 hours of trading in crypto → Significant weight
- Weekly candle: Represents 7 days of trading → Major weight
Key Insight:
A daily candle carries 1,440x more weight than a 1-minute candle. Always consider timeframe when interpreting candlestick significance.
VI. Crypto-Specific Candlestick Characteristics
Unique Crypto Features
- 24/7 Trading: No market gaps between candles
- Higher Wick Frequency: Crypto candles often have longer wicks due to volatility
- Weekend Activity: Sunday candles can be significant despite lower volume
- Exchange Variations: Same asset may show different candles across exchanges
Common Crypto Patterns
- Long-Wicked Dojis: Frequent in high-volatility alts
- Marubozu Clusters: Common during strong trend moves
- Gapping on News: Rare but occurs during major announcements
- Weekend Reversals: Often start/end with distinct candle patterns
VII. Practical Trading Implications
Reading the Story: 3 Key Questions
1. Who won the period?
Check body color: Green = buyers, Red = sellers
2. How strong was the win?
Measure body size relative to recent candles and overall volatility
3. Was there opposition?
Analyze wick size and position to gauge rejection levels
Example Interpretations:
- Strong Green, Small Wicks: Buyers controlled entire period → Bullish continuation likely
- Small Red, Long Upper Wick: Sellers won slightly, strong rejection at highs → Potential reversal
- Doji with Long Wicks: Complete equilibrium → Major decision point ahead
VIII. Best Practices for Candlestick Analysis
✅ Do's
- Always consider preceding price action context
- Use multiple timeframes for confirmation
- Combine with volume and other indicators
- Practice pattern recognition on historical charts
- Wait for candle close before making decisions
❌ Don'ts
- Never trade based on a single candle alone
- Don't ignore location (support/resistance)
- Avoid trading against higher timeframe trend
- Don't forget risk management - always use stops
- Avoid overtrading based on minor candle patterns
IX. Quick Reference Guide
| Candle Type | Structure | Typical Meaning | Warning Signs |
|---|---|---|---|
| Marubozu | No wicks, full body | Strong directional conviction | Can signal exhaustion at extremes |
| Spinning Top | Small body, medium wicks | Indecision, equilibrium | Often leads to false breakouts |
| Doji | No body, wicks vary | Extreme indecision | Requires strong confirmation |
| Hammer | Long lower wick, small upper | Bullish reversal at support | Must be at bottom of trend |
| Shooting Star | Long upper wick, small body | Bearish reversal at resistance | Must be at top of trend |
Conclusion
The candlestick is more than just a price chart component - it's a visual representation of market psychology, capturing the eternal struggle between fear and greed, buying and selling pressure. By mastering candlestick structure, you gain the ability to read market sentiment in real-time, identify potential turning points, and make more informed trading decisions. Remember that while individual candles provide clues, it's the patterns they form collectively that offer the highest probability trading signals. In the fast-paced world of crypto trading, the ability to quickly and accurately interpret candlestick structures is an essential skill that separates reactive traders from proactive ones. In the next lesson (5.2), we'll explore specific candlestick patterns and their predictive power in crypto markets.
5.2 Basic Candlestick Types
Key idea
Candlestick patterns are the alphabet of market language. Each type tells a specific story about the battle between buyers and sellers.
Candlestick patterns are the alphabet of market language. Each type tells a specific story about the battle between buyers and sellers. Mastering these basic types gives you the foundation to read market sentiment and anticipate price movements. Here are the essential candlestick types every crypto trader must know.
I. Single Candlestick Patterns
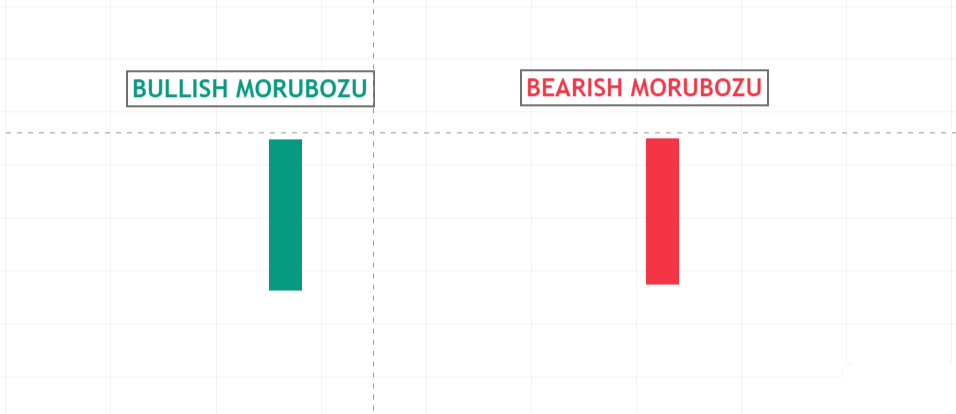
1. Marubozu (The Conviction Candle)
Structure:
- No wicks (shadows) - body extends from high to low
- Bullish Marubozu: Open = Low, Close = High
- Bearish Marubozu: Open = High, Close = Low
Interpretation:
- Maximum conviction from buyers (bullish) or sellers (bearish)
- Shows one-sided control with no opposition
- Often signals continuation of current trend
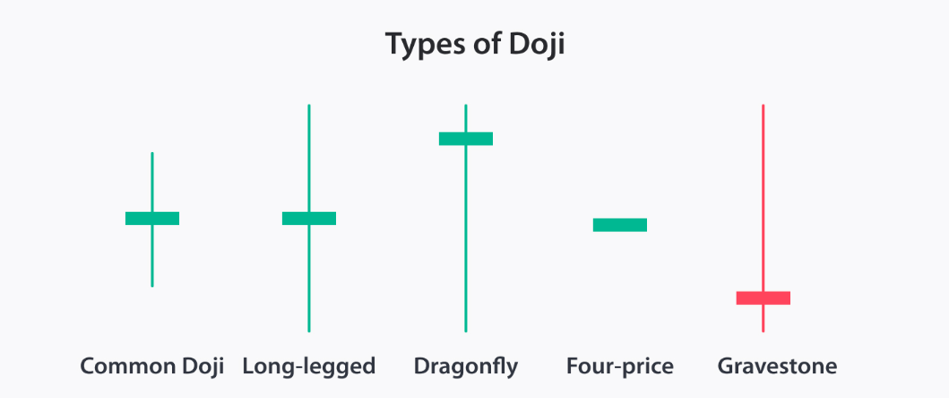
2. Doji (The Indecision Candle)
Structure & Variations:
- Open = Close (or very close), forming cross/plus
- Standard Doji: Small body with similar wicks
- Long-Legged Doji: Very long upper and lower wicks
- Gravestone Doji: Long upper wick, no lower wick
- Dragonfly Doji: Long lower wick, no upper wick
Significance:
- Perfect equilibrium between buyers and sellers
- Often signals trend exhaustion
- Can indicate potential reversal points
- Requires confirmation from next candle
3. Spinning Top (The Neutral Candle)
Structure: Small body with wicks longer than the body
Interpretation: Indecision with both sides testing limits
Significance: Neutral signal, often precedes consolidation or trend change
Key Insight:
The smaller the body relative to wicks, the greater the indecision. Often appears before major breakouts.
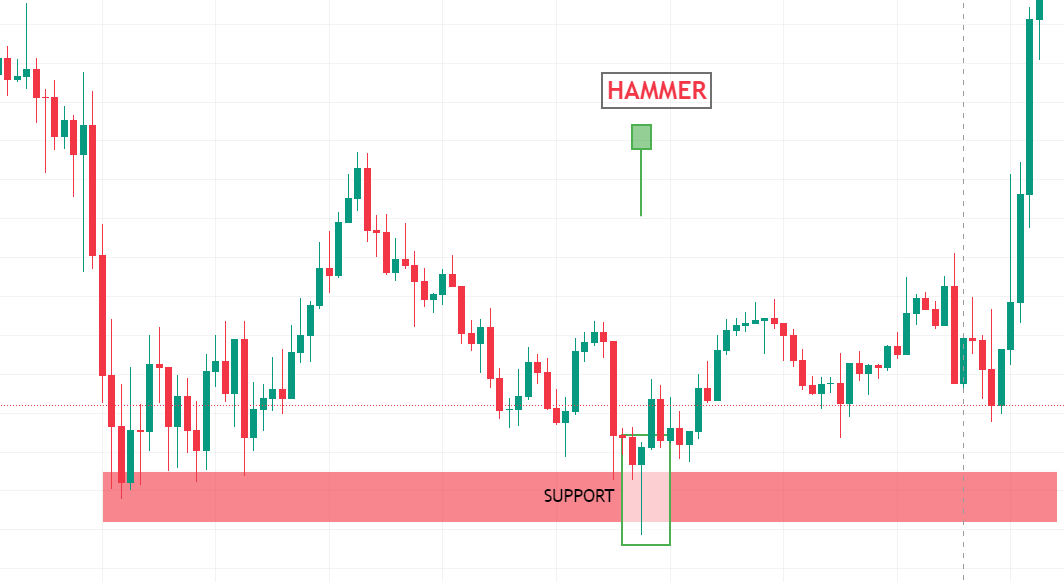
4. Hammer (Bottom Reversal)
- Structure: Small body at top, long lower wick (≥2x body), little/no upper wick
- Location: Must appear at bottom of downtrend
- Psychology: Sellers pushed down, buyers aggressively bought dip
- Confirmation: Next candle should close above hammer's high
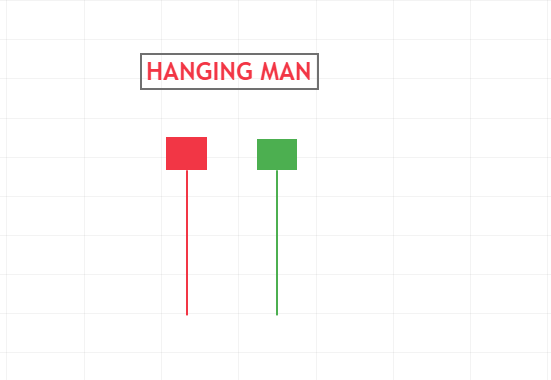
5. Hanging Man (Top Warning)
- Structure: Identical to hammer but at top of uptrend
- Psychology: Bulls pushed up, sellers aggressively sold rally
- Critical: Only valid after uptrend (otherwise it's a hammer)
- Confirmation: Next candle should close below hanging man's low
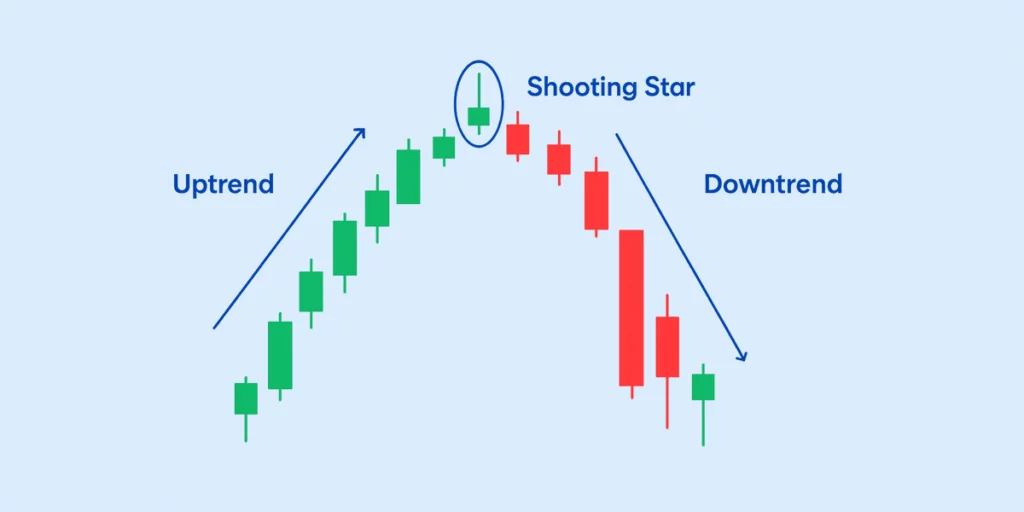
6. Shooting Star (Top Reversal)
- Structure: Small body at bottom, long upper wick (≥2x body), little/no lower wick
- Location: Must appear at top of uptrend
- Psychology: Buyers pushed up, sellers aggressively sold into strength
- Confirmation: Next candle should close below shooting star's low
7. Inverted Hammer (Bottom Hope)
- Structure: Similar to shooting star but at bottom of downtrend
- Psychology: Buyers attempted rally but were rejected, shows buying interest
- Interpretation: First sign of bullish pressure after downtrend
- Confirmation: Next candle should close above inverted hammer's high
II. Two-Candle Patterns
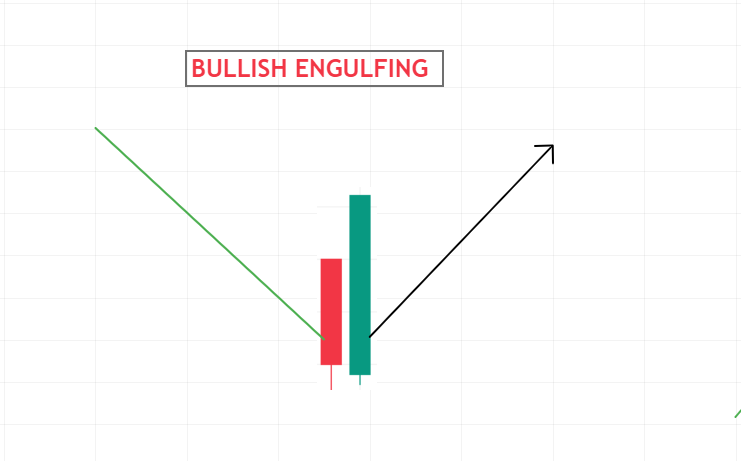
8. Bullish Engulfing Pattern
- Structure: Small bearish candle → Larger bullish candle engulfing first
- Location: Bottom of downtrend
- Psychology: Dramatic shift from bearish to bullish control
- Strength: Larger engulfing candle = stronger signal
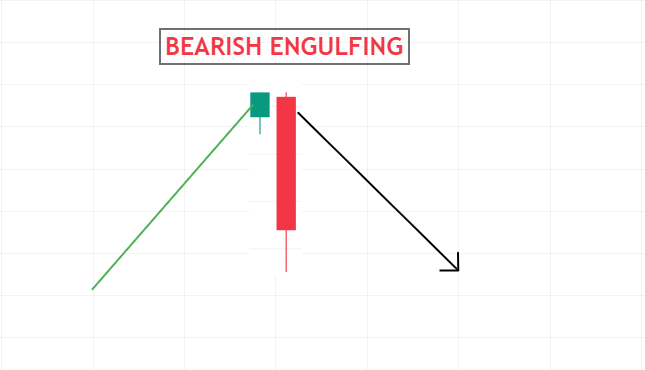
9. Bearish Engulfing Pattern
- Structure: Small bullish candle → Larger bearish candle engulfing first
- Location: Top of uptrend
- Psychology: Dramatic shift from bullish to bearish control
- Strength: Larger engulfing candle = stronger signal
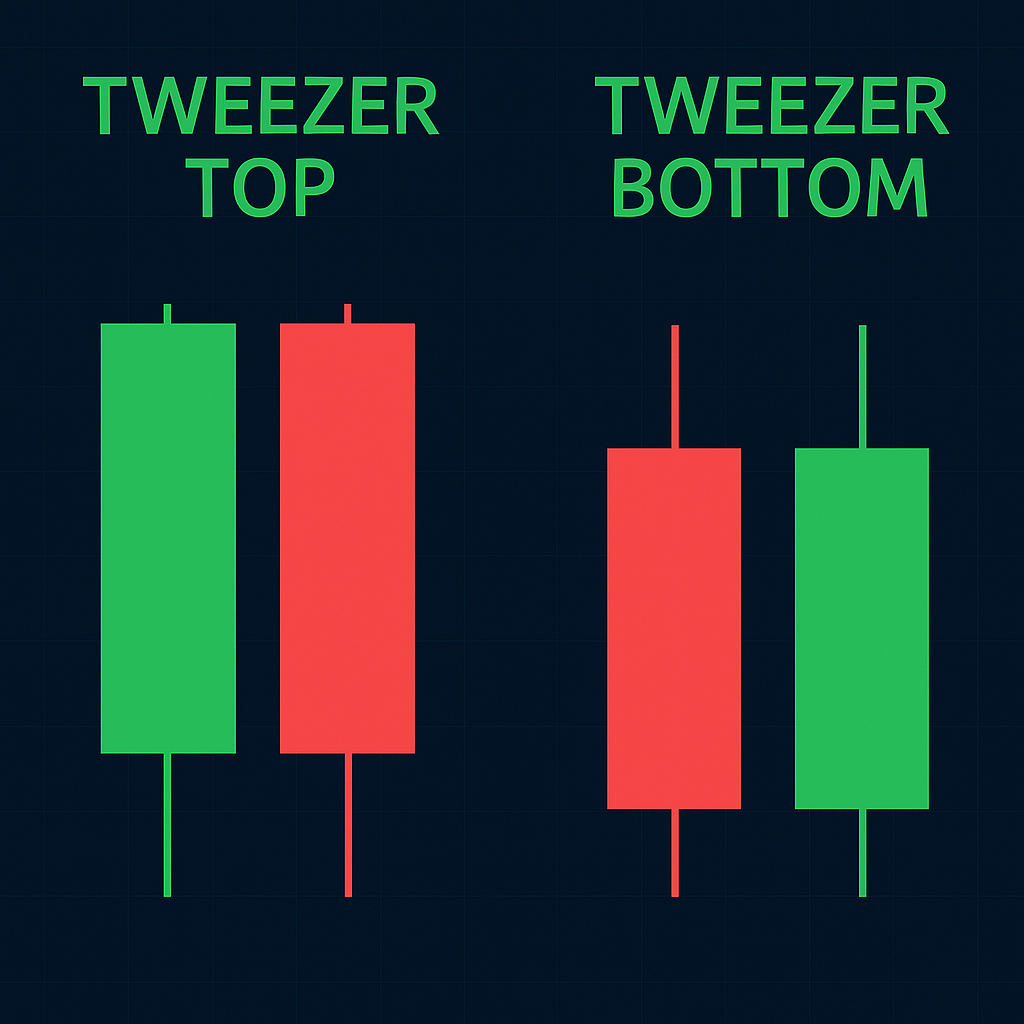
10. Tweezer Tops/Bottoms
- Two candles with identical highs/lows
- Shows strong rejection at level
- Market unable to break through
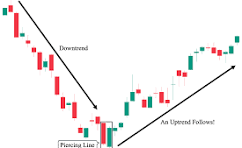
11. Piercing Pattern
- Bearish → Bullish closes above midpoint
- Moderate bullish reversal
- Not as strong as engulfing
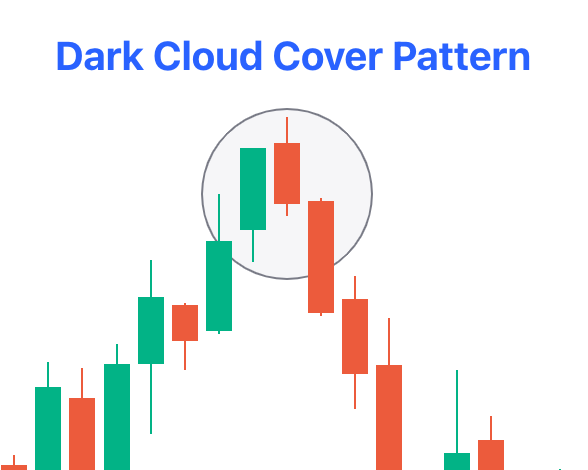
12. Dark Cloud Cover
- Bullish → Bearish closes below midpoint
- Moderate bearish reversal
- Not as strong as engulfing
III. Three-Candle Patterns
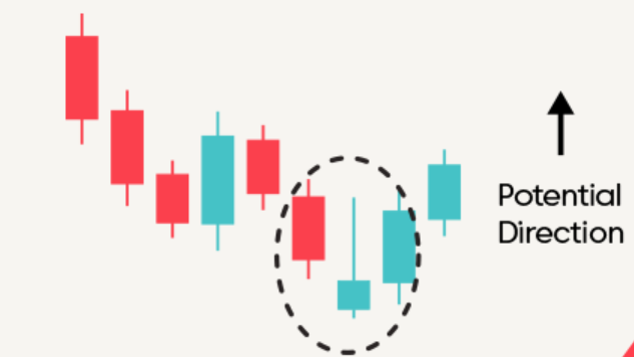
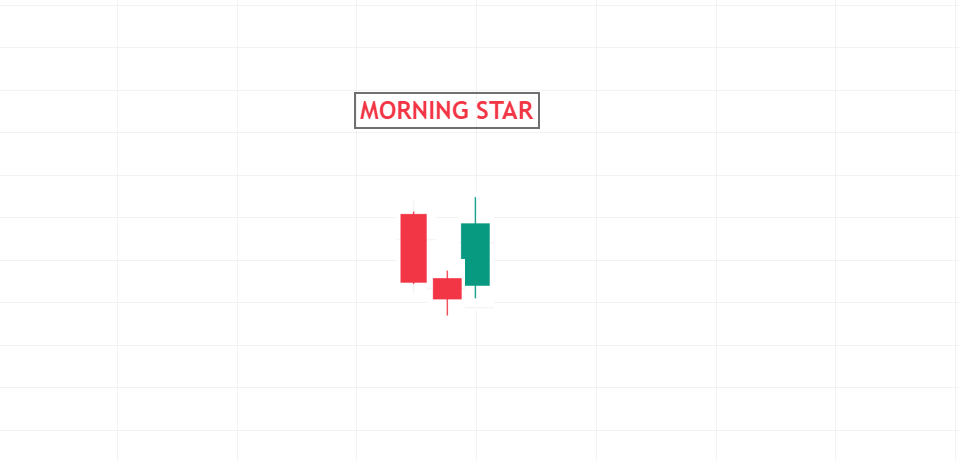
13. Morning Star (Bullish)
Structure:
- Long bearish candle
- Small-bodied candle (doji/spinning top) gaps down
- Long bullish candle gaps up, closes above midpoint of 1
Psychology: Bears exhausted → Indecision → Bulls take control
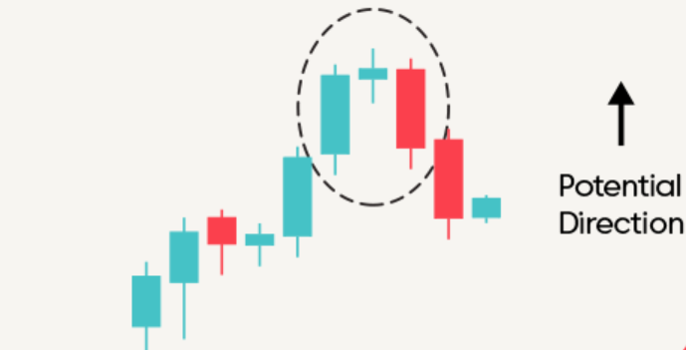
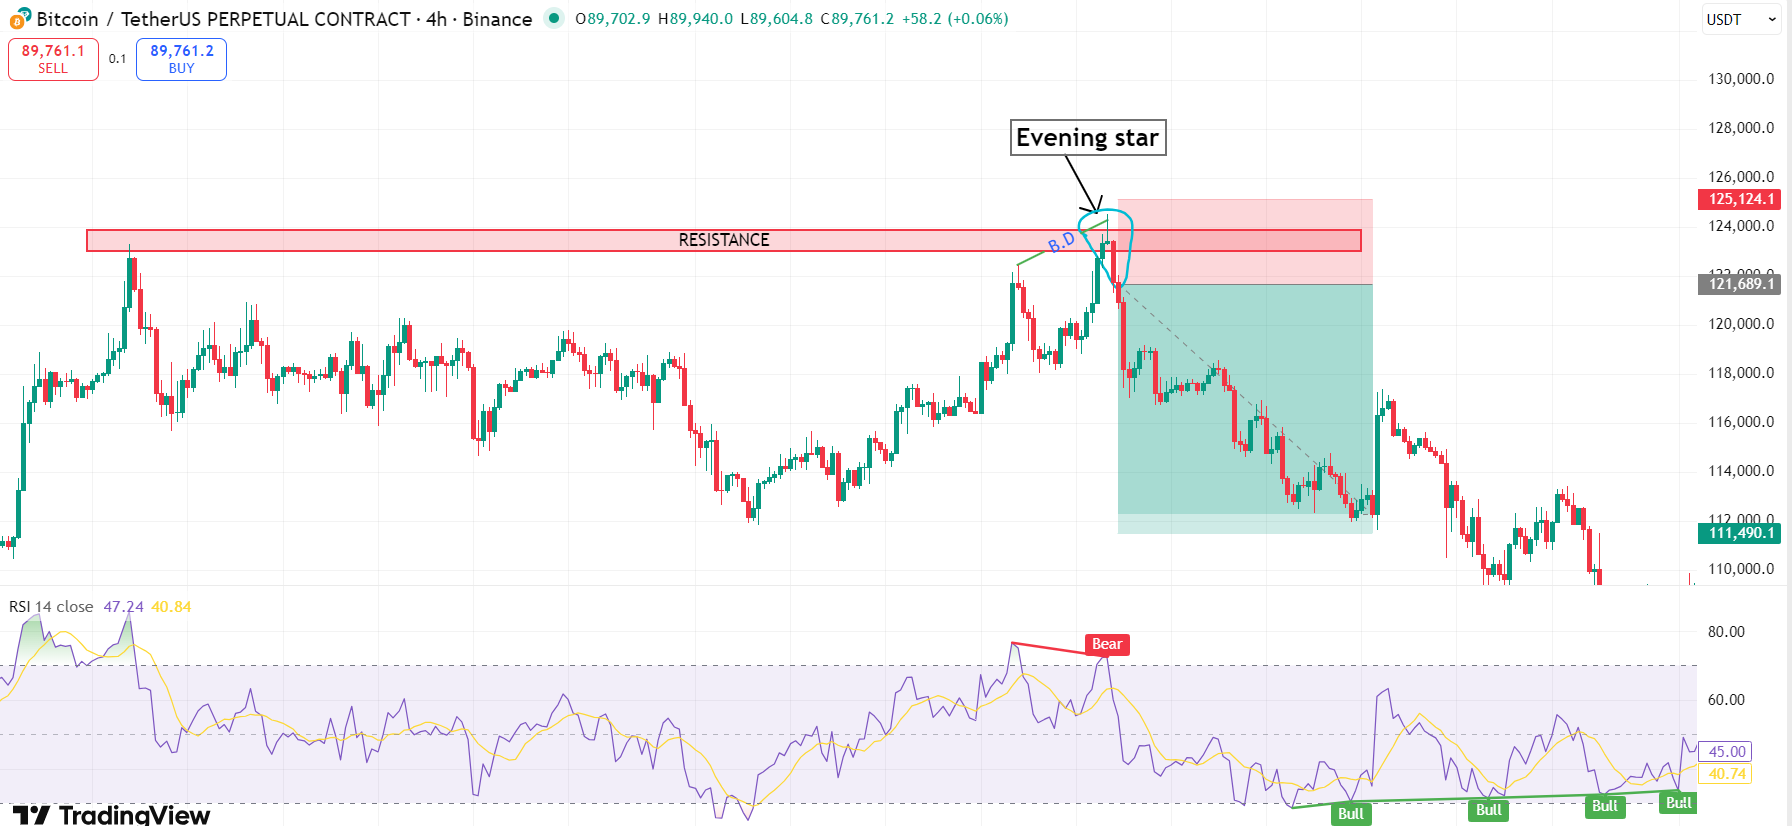
14. Evening Star (Bearish)
Structure:
- Long bullish candle
- Small-bodied candle (doji/spinning top) gaps up
- Long bearish candle gaps down, closes below midpoint of 1
Psychology: Bulls exhausted → Indecision → Bears take control
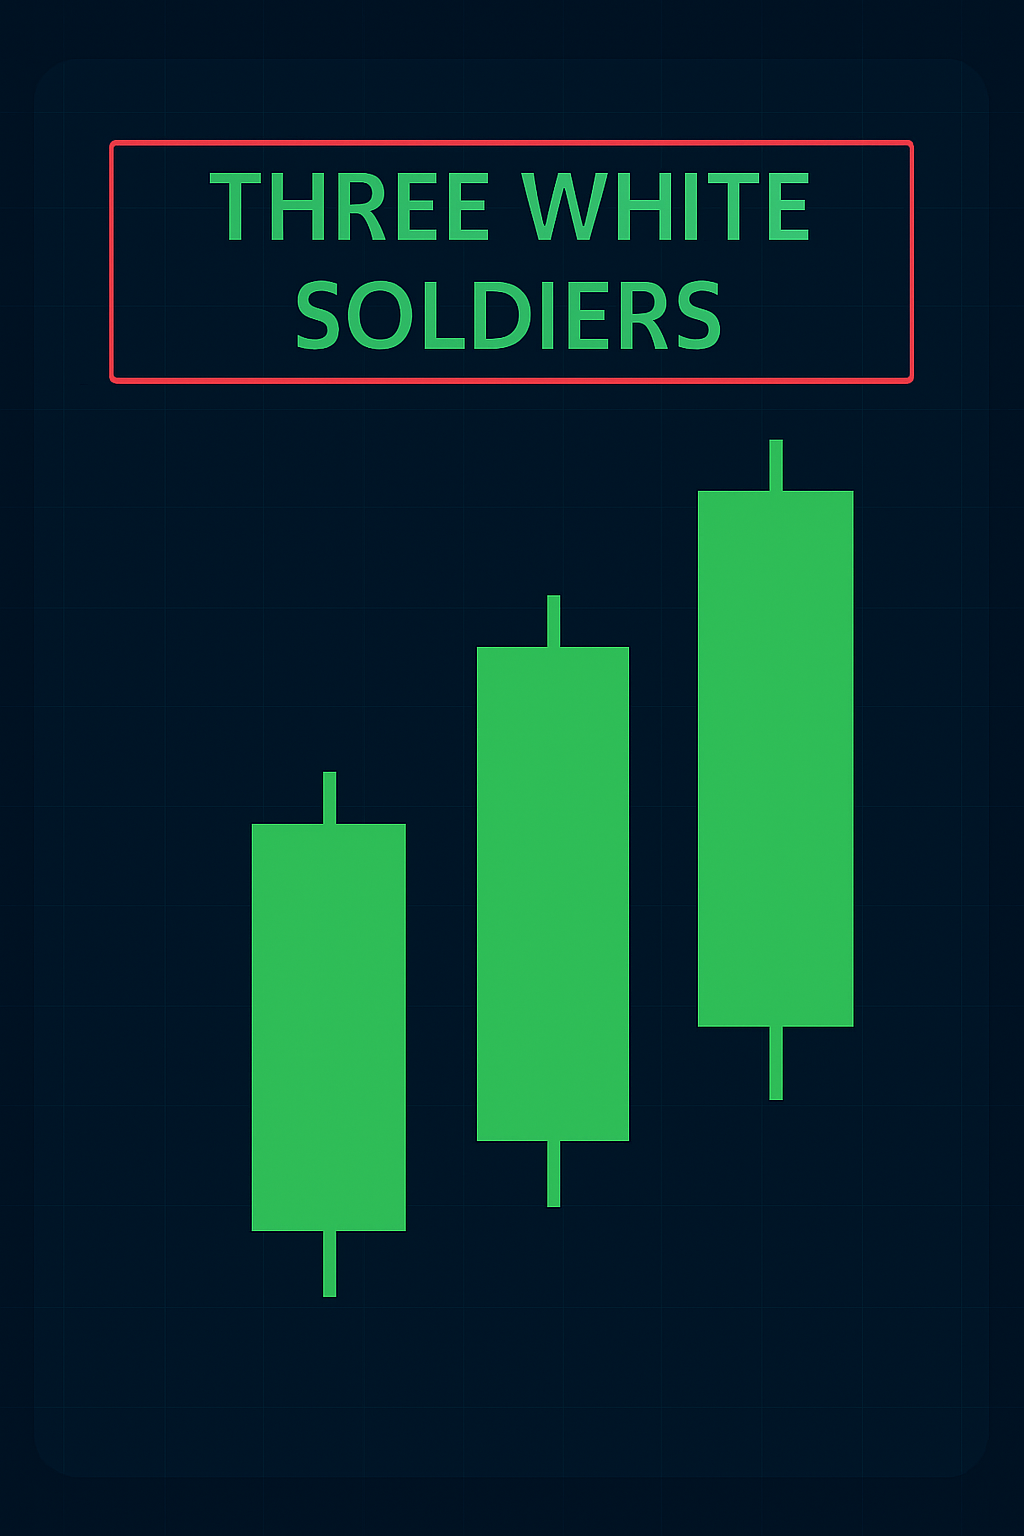
15. Three White Soldiers
- Structure: Three consecutive long bullish candles with higher closes
- Interpretation: Very strong bullish momentum
- Psychology: Sustained buying without significant pullbacks
- Warning: Often appears near tops as exhaustion move
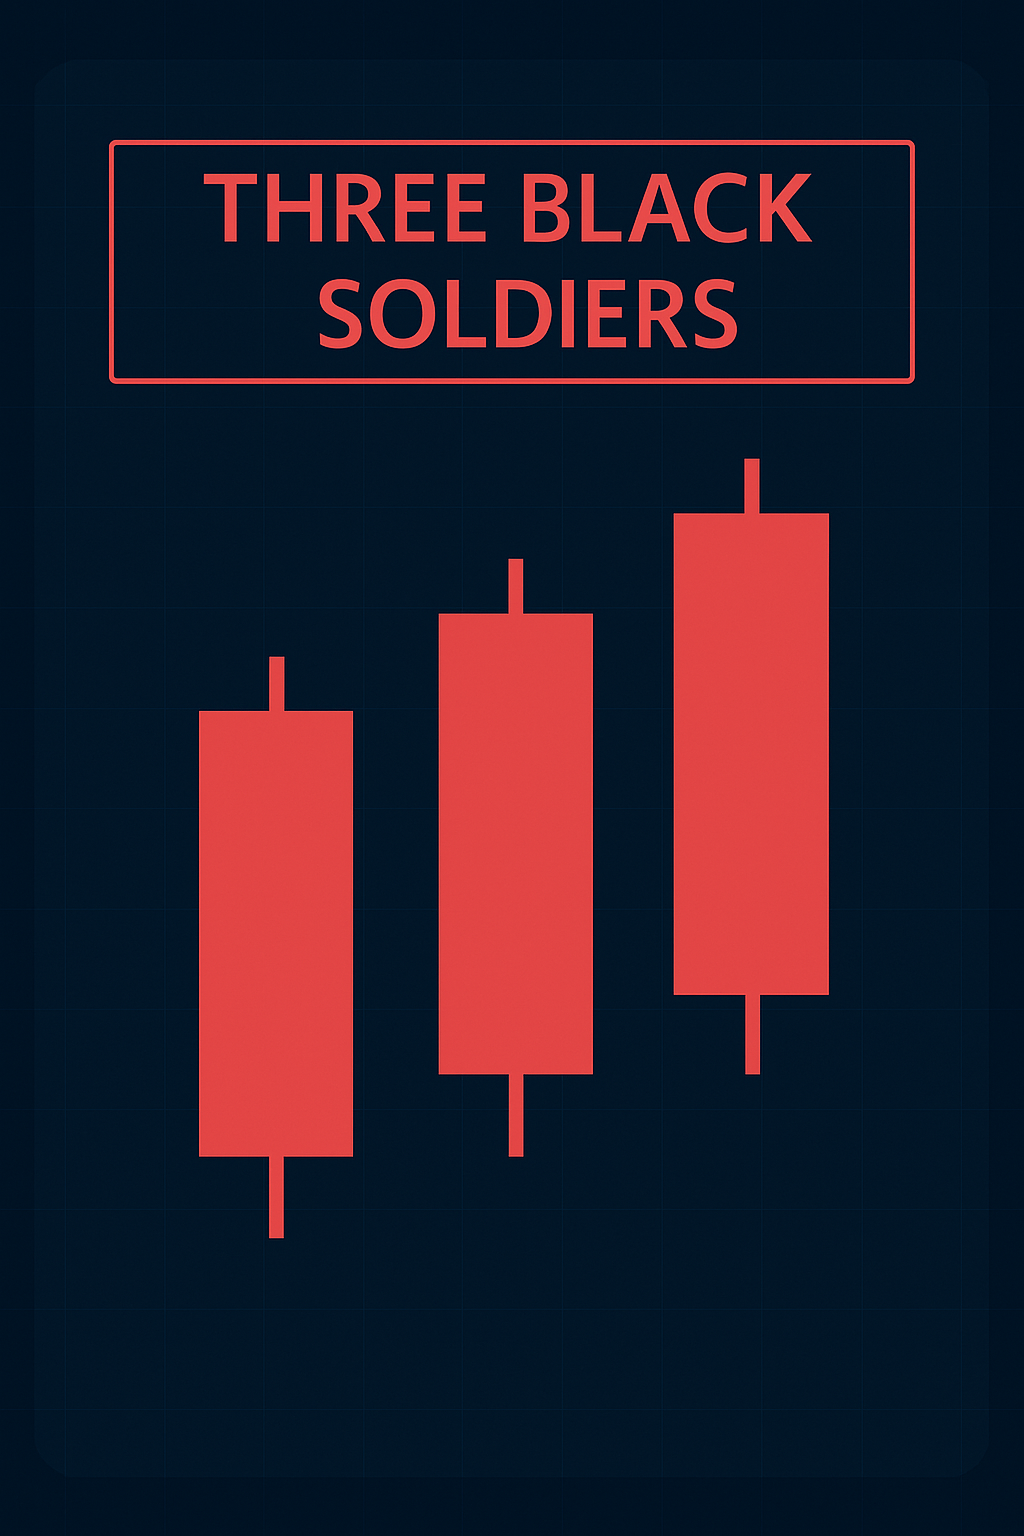
16. Three Black Crows
- Structure: Three consecutive long bearish candles with lower closes
- Interpretation: Very strong bearish momentum
- Psychology: Sustained selling without significant bounces
- Warning: Often appears near bottoms as selling climax
IV. Special Crypto Candlestick Types
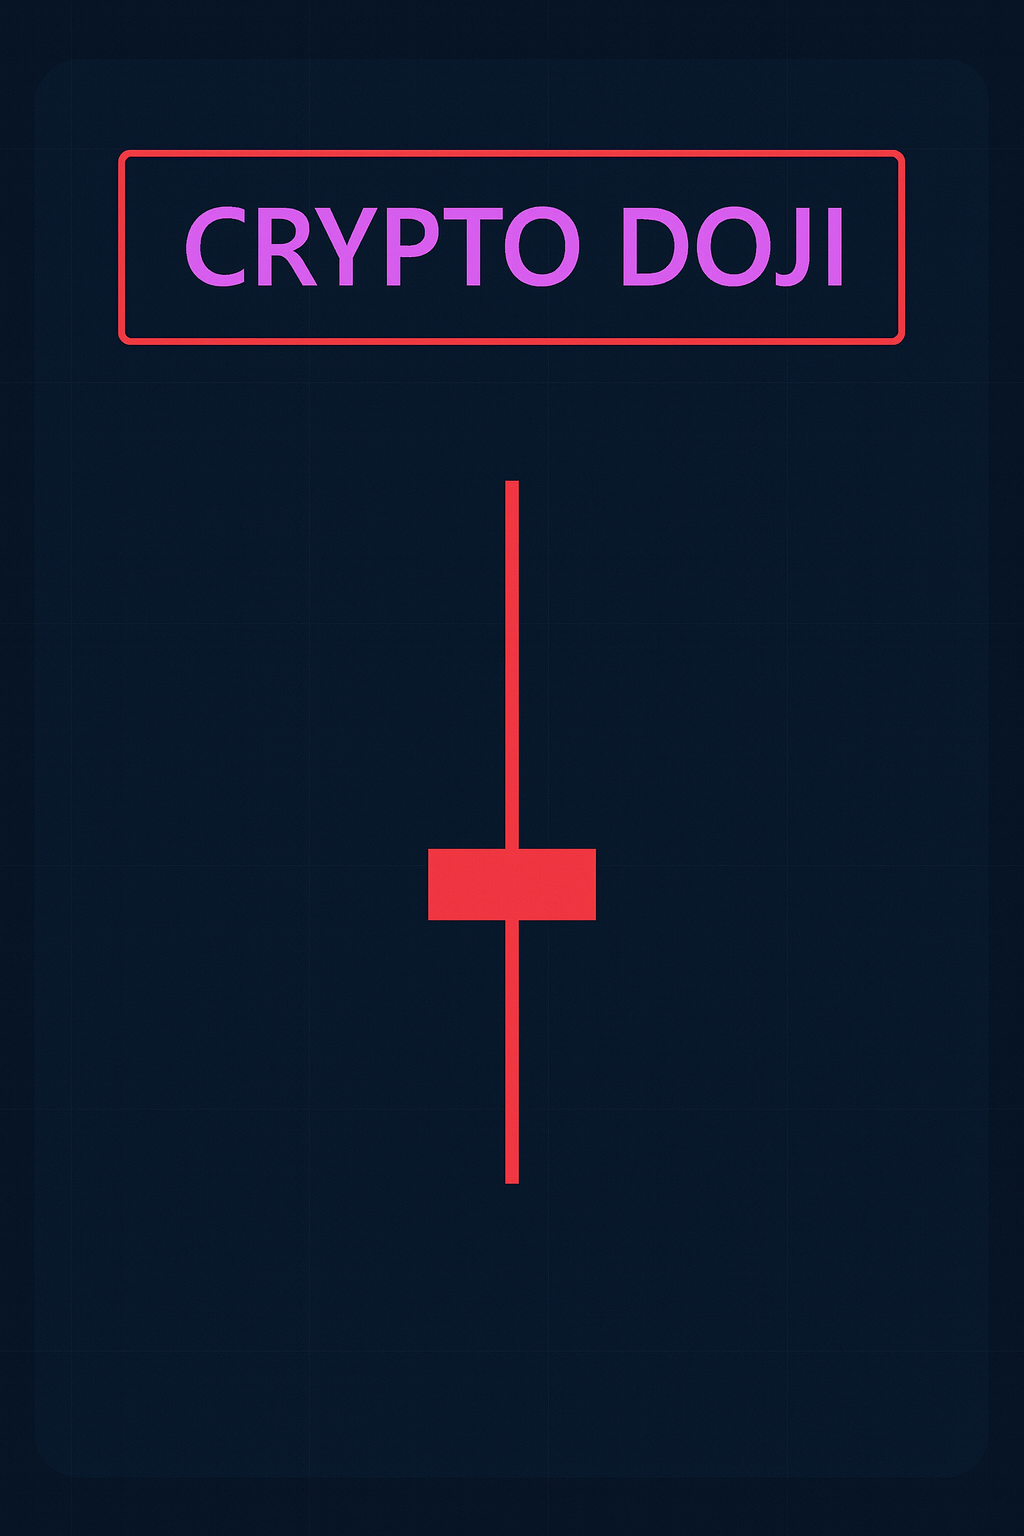
17. Crypto Doji
- Tiny body with extremely long wicks (5-10x body)
- Common in low-cap altcoins & high-impact news
- Extreme volatility with no directional conviction
- Trading: Avoid until clearer direction emerges
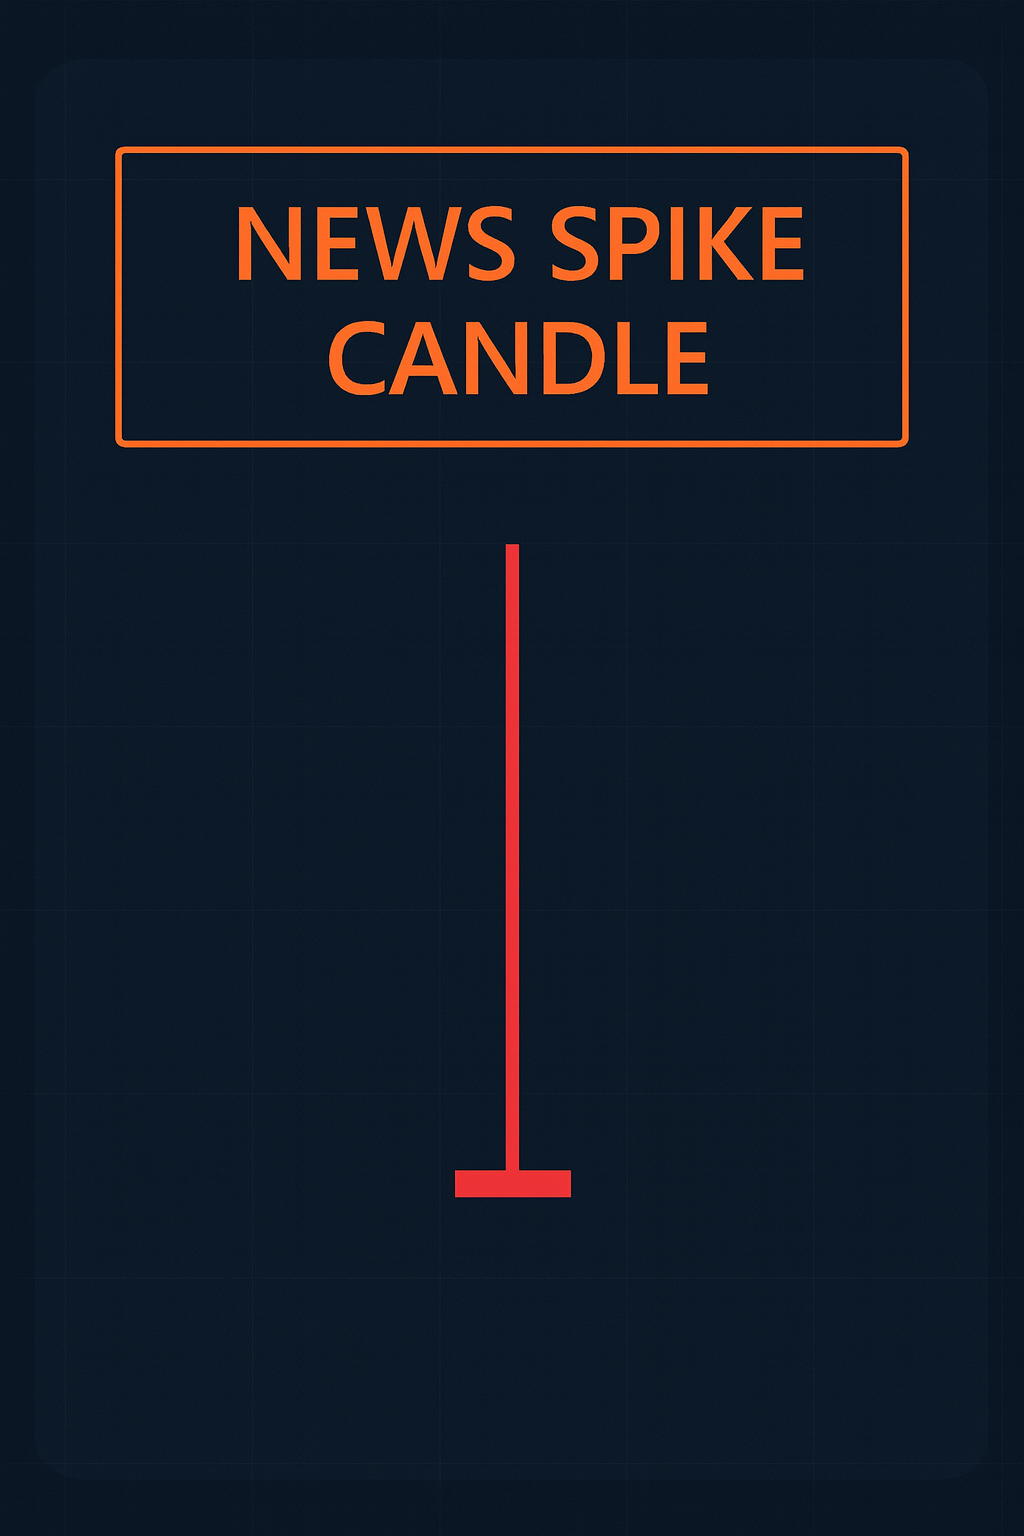
18. News Spike Candle
- Very long wick in one direction, small opposite wick
- During major announcements (regulatory, partnerships, hacks)
- Knee-jerk reaction followed by mean reversion
- Psychology: Panic → Rational assessment
19. Weekend Accumulation
- Small body, long lower wick (Sunday/Monday)
- Common in Bitcoin & major alts
- Institutional/whale accumulation during low liquidity
- Psychology: Smart money buying when retail attention low
20. Liquidation Candle
- Extreme wick in one direction (10-20% moves)
- During leveraged market liquidations
- Forced selling/buying triggering cascade
- Warning: Often gets significantly retraced
V. Pattern Strength Hierarchy
| Strength | Pattern | Success Rate | Best Timeframe |
|---|---|---|---|
| Very Strong | Morning/Evening Star | 65-75% | Daily, 4H |
| Strong | Engulfing Patterns | 60-70% | Daily, 4H |
| Moderate | Hammer/Shooting Star | 55-65% | 4H, 1H |
| Weak | Doji/Spinning Top | 50-55% | All timeframes |
| Contextual | Single Marubozu | Varies | Needs confirmation |
VI. Practical Application Framework
Step 1: Identify
Is it single, double, or triple pattern? Body-to-wick ratio? Location?
Step 2: Context
Patterns at S/R are 3x more reliable. Check higher TF trend & volume.
Step 3: Confirm
Never trade unconfirmed. Wait for next candle close in predicted direction.
Step 4: Risk Mgmt
SL below pattern low (bullish) / above high (bearish). TP based on pattern size.
VII. Crypto-Specific Considerations
Challenges & Solutions
- False Patterns: 24/7 trading creates more patterns → Trade only daily/4H for reliability
- Weekend Reliability: Fri-Mon patterns often more reliable due to institutional activity
- Exchange Differences: Same asset shows different patterns → Use highest volume exchange
- Leverage Effects: Extreme wicks from liquidations → Wait for retest before trading
- News Patterns: Invalid during major news → Wait 2-3 candles after news settles
Common Mistakes to Avoid
- Trading Every Pattern: Focus on high-probability setups only
- Ignoring Timeframe: 1-minute patterns have minimal significance
- No Confirmation: Entering before pattern is confirmed
- Wrong Location: Trading hammer in middle of uptrend (it's hanging man!)
- Volume Ignorance: Patterns without volume confirmation are weak
- Overlooking Context: Pattern without trend alignment is dangerous
VIII. Practice Exercise
Analyze This Scenario:
Daily Bitcoin chart shows 3-day downtrend
Today's candle: Small body at top, long lower wick (2.5x body), tiny upper wick
Candle closed at key $40,000 support level
Volume: 30% above average
Next step?
Answer:
This is a Hammer at support with above-average volume. Wait for next candle to close above hammer's high for confirmation. If confirmed, bullish reversal likely with target at recent resistance. Stop loss below hammer's low.
Conclusion
Mastering Basic Candlestick Types:
🔑 Context is King: A hammer at support ≠ hammer in middle of trend
👑 Confirmation is Queen: Never trade before pattern is confirmed
👶 Volume is the Prince: Patterns without volume are weak signals
⚖️ Timeframe is the Court: Daily patterns > 1H > 1M patterns
🎯 Start with Essentials: Marubozu, Doji, Hammer, Shooting Star, Engulfing, Morning/Evening Star
🧠 Read Psychology: Candles show fear, greed, indecision, conviction
The most profitable traders don't just see candles - they read the
psychological battle they represent. In crypto's volatile
environment, candlestick patterns provide the visual clues you
need to anticipate moves before they happen. Practice pattern
recognition daily on historical charts, starting with the 6
essential patterns, and soon you'll be reading the market like an
open book. Remember: while individual candles provide clues, it's
the patterns they form collectively that offer the highest
probability trading signals. Always combine candlestick analysis
with proper risk management and other technical tools for best
results.
Next Lesson (5.3): Introduction to technical indicators and how
to combine them with candlestick patterns for even higher
probability trades.
5.3 Introduction to Technical Indicators
Key idea
Technical indicators are mathematical calculations that help traders analyze market conditions, identify trends, and generate trading signals.
Technical indicators are mathematical calculations based on price, volume, or open interest that help traders analyze market conditions, identify trends, and generate trading signals. While candlesticks show the "what" and "when" of price action, indicators provide the "why" and "how strong" behind market movements.
I. What Are Technical Indicators?
Definition & Purpose
- Confirm price action and market trends
- Predict future price movements based on historical patterns
- Identify overbought/oversold conditions and potential reversals
- Transform raw market data into visual representations
The Indicator Philosophy
Core Principles:
- Market Discounts Everything: All known information is already in price
- History Repeats Itself: Market psychology creates predictable patterns
II. Key Indicator Categories
Trend Indicators
- Purpose: Identify trend direction & strength
- Best For: Trending markets
- Examples: MA, MACD, ADX, Ichimoku
- Type: Lagging (confirm trends)
Momentum Indicators
- Purpose: Measure speed & strength of price
- Best For: Overbought/oversold conditions
- Examples: RSI, Stochastic, CCI
- Type: Leading (predict reversals)
Volatility Indicators
- Purpose: Measure rate of price changes
- Best For: Setting stops & position sizing
- Examples: Bollinger Bands, ATR
- Type: Lagging/Leading
Volume Indicators
- Purpose: Analyze trading activity
- Best For: Validating breakouts
- Examples: Volume Profile, OBV, VWAP
- Type: Confirmation
III. The Most Essential Indicators for Crypto Trading
Indicator #1: Moving Averages (MA)
Details:
- Type: Trend (Lagging)
- Calculation: Average of closing prices
- Key Periods: 9, 20, 50, 100, 200
- Types: SMA (Simple), EMA (Exponential)
Primary Uses:
- Trend identification (price above/below MA)
- Dynamic support/resistance levels
- Golden Cross / Death Cross signals
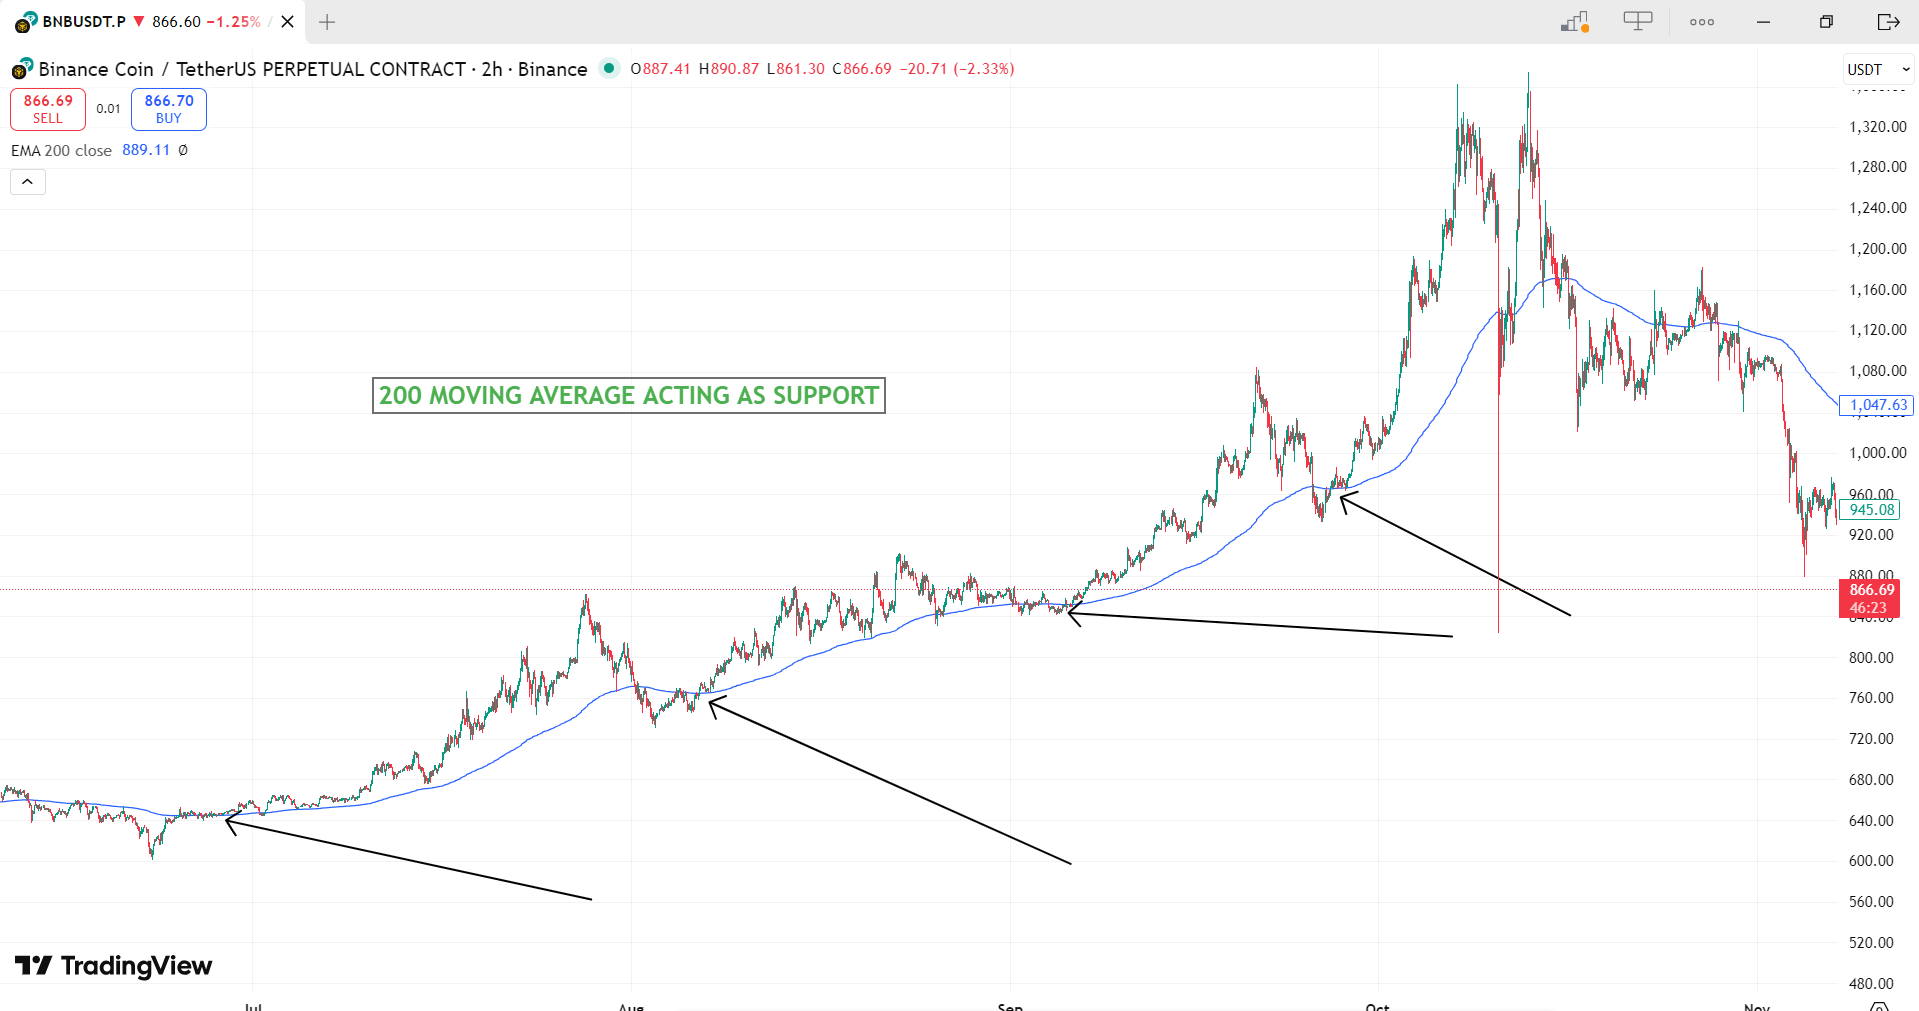
Crypto-Specific Tips:
Use EMA for faster response to volatile markets. 200 EMA often acts as major support/resistance. Multiple MAs create "ribbon" showing trend strength.
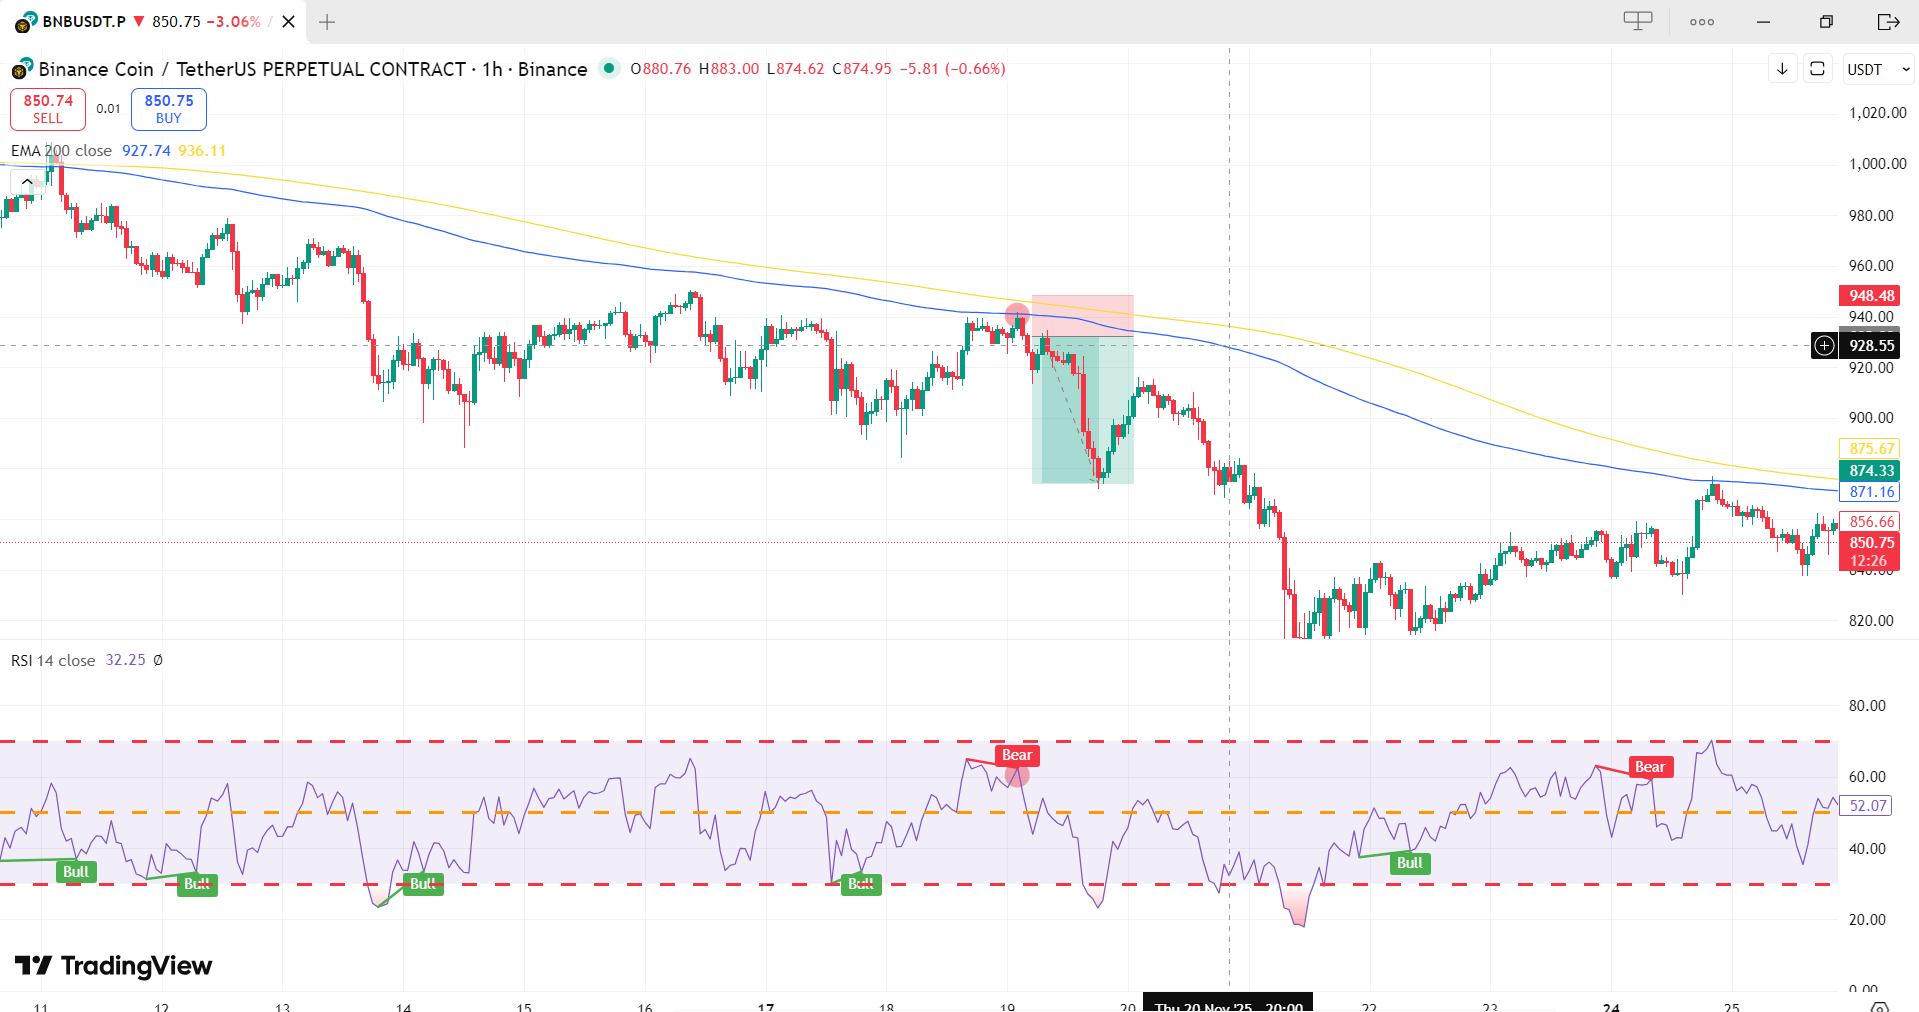
Indicator #2: Relative Strength Index (RSI)
Details:
- Type: Momentum (Leading)
- Calculation: Measures speed of price (0-100 scale)
- Standard: 14 periods
- Scale: 0-100
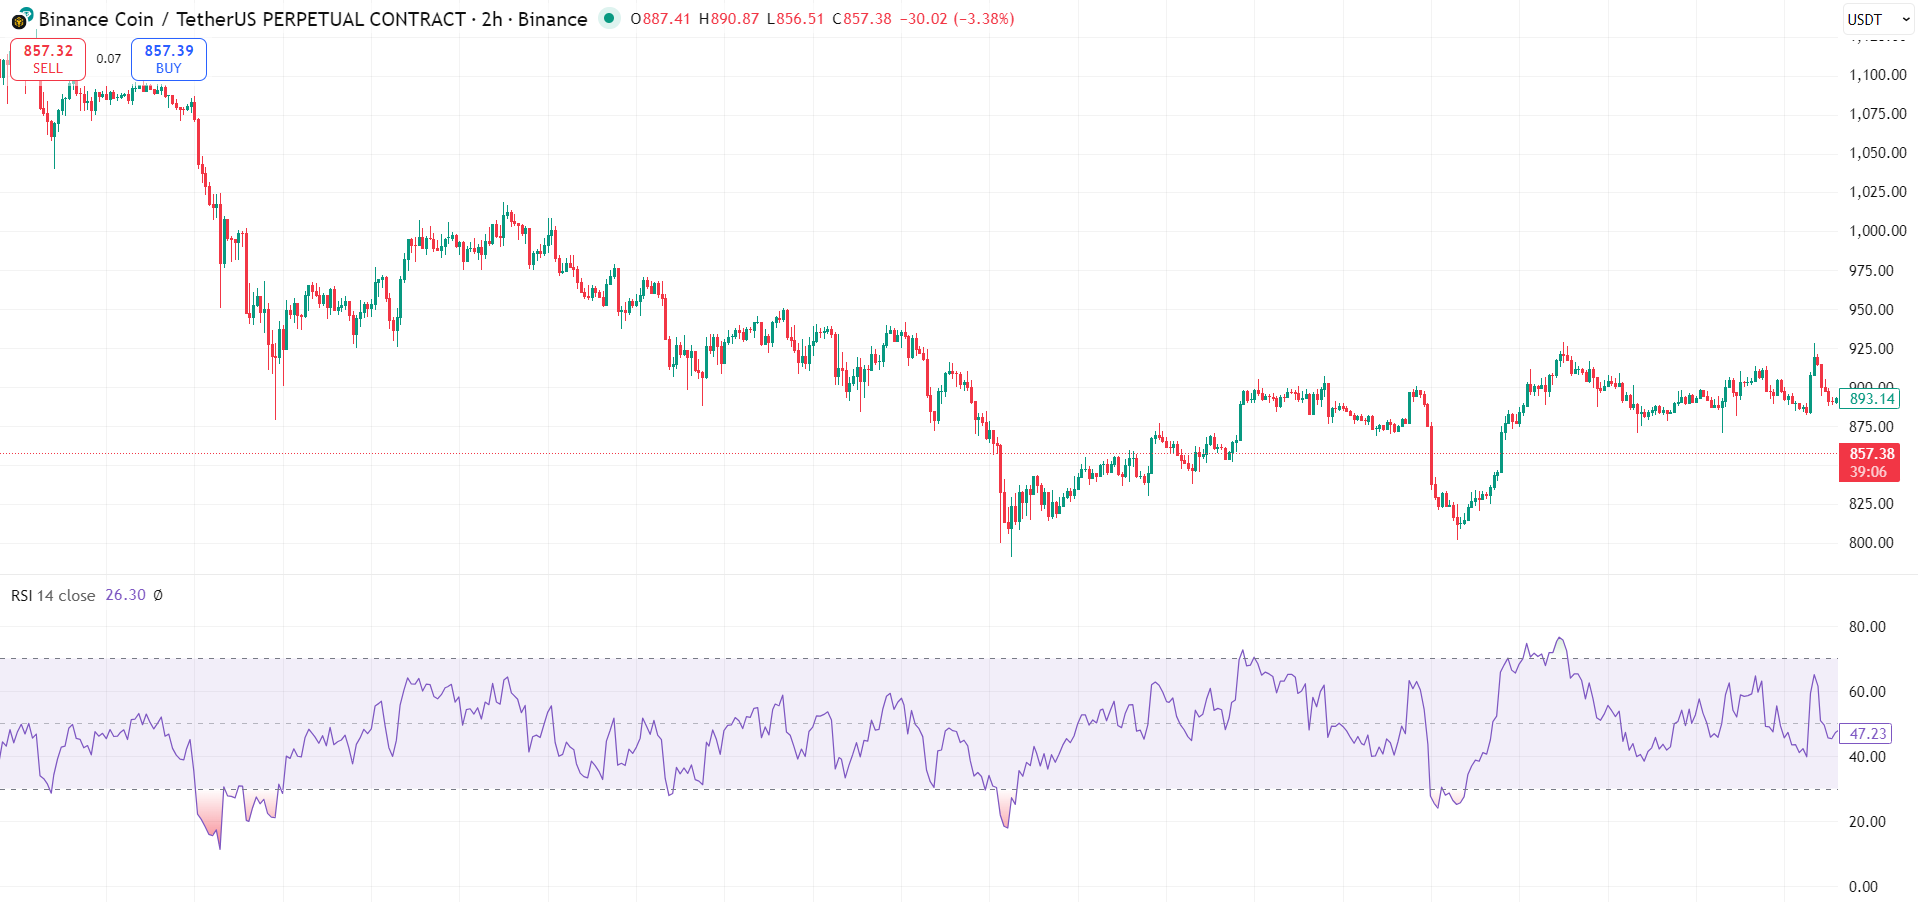
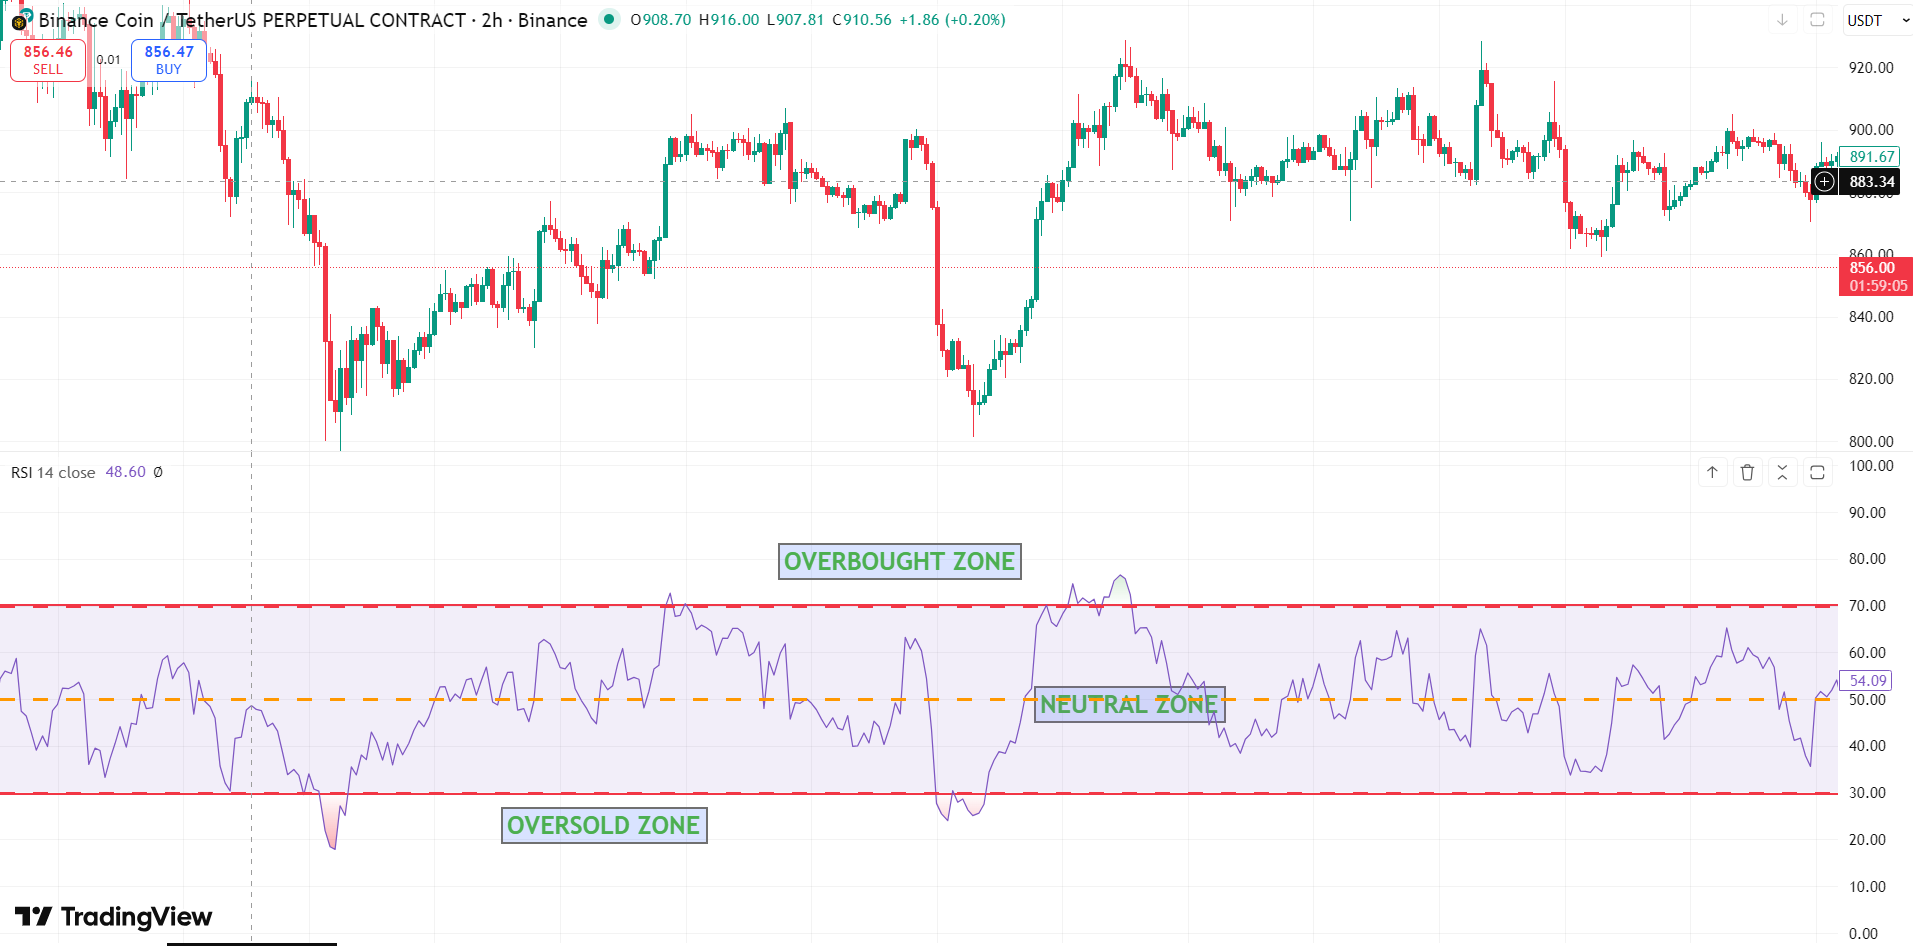
Key Levels:
- Overbought: >70 (consider selling)
- Oversold: <30 (consider buying)
- Neutral: 30-70
Primary Uses:
- Identify overbought/oversold conditions
- Spot divergence (price vs RSI)
- Trend confirmation (above/below 50)
- Momentum measurement
Crypto Tip:
Crypto can stay extreme longer. Use 20/80 for conservative trading.
Indicator #3: MACD (Moving Average Convergence Divergence)
Components:
- MACD Line: (12 EMA - 26 EMA)
- Signal Line: 9 EMA of MACD Line
- Histogram: Difference between MACD & Signal
- Zero Line: Bullish above, bearish below
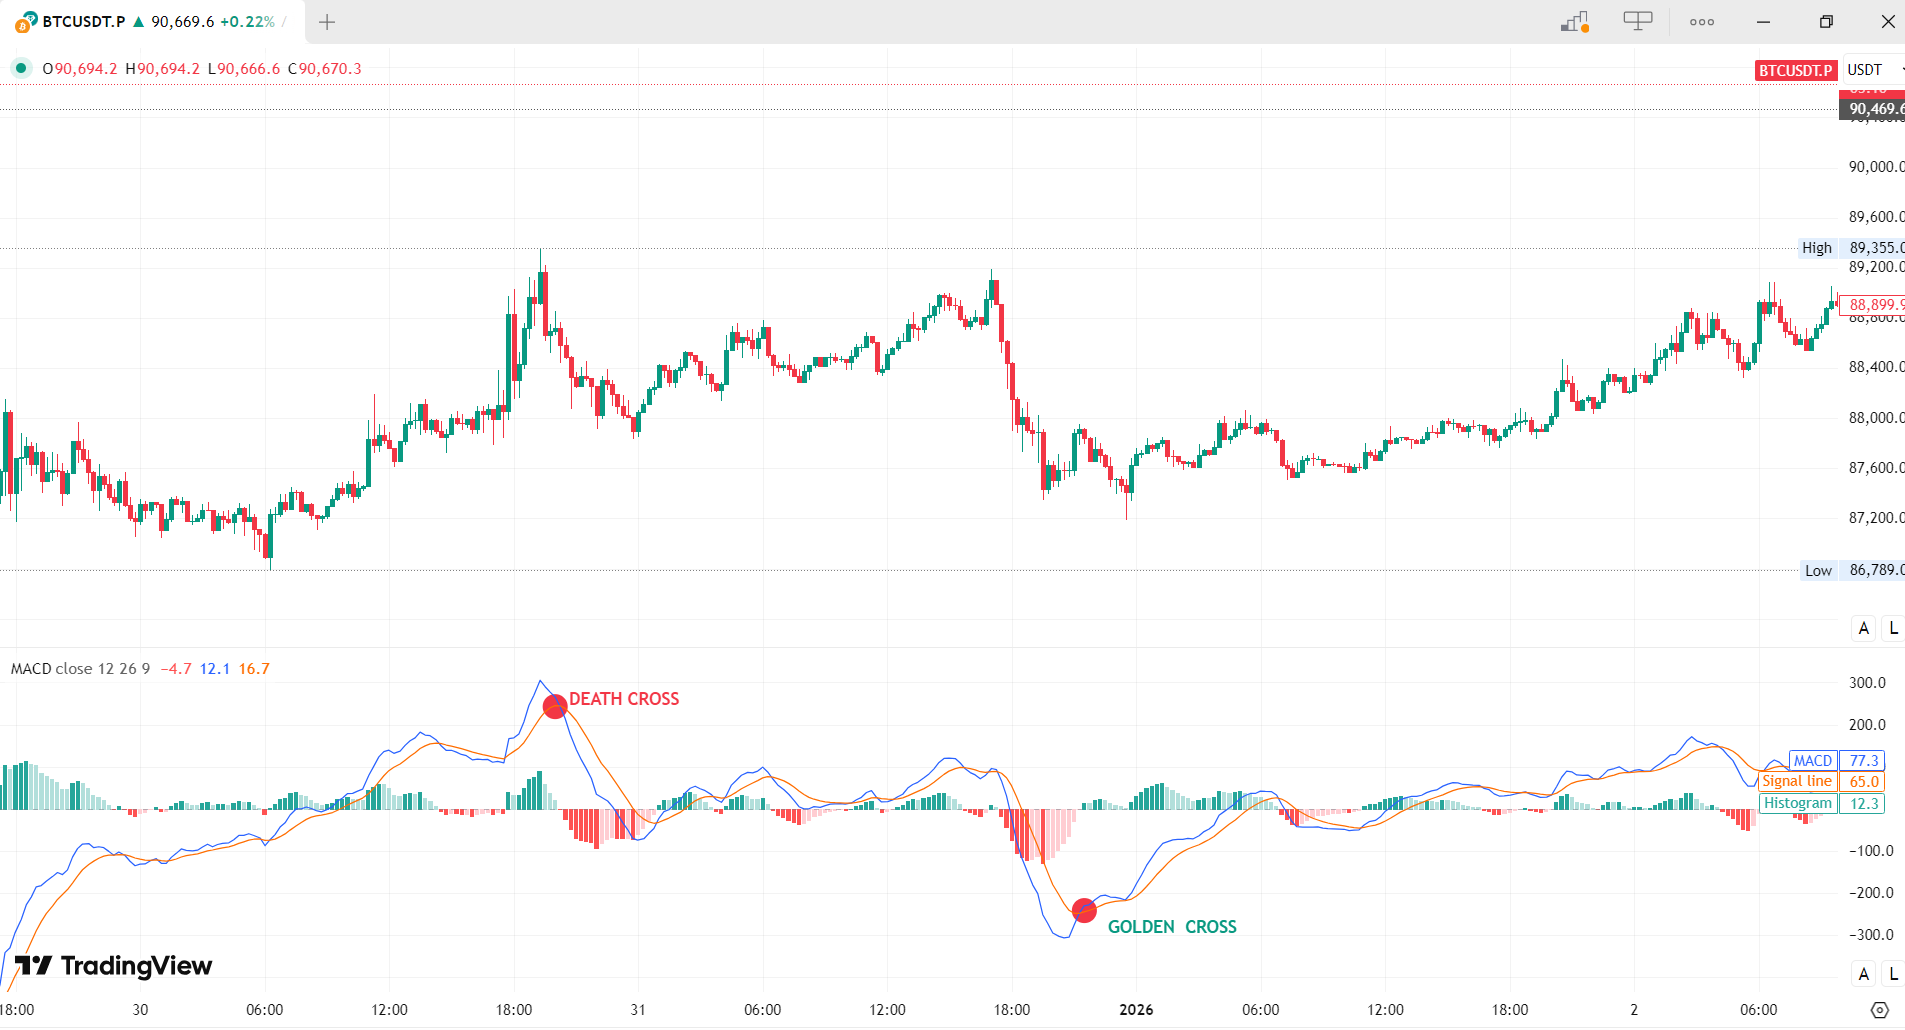
Trading Signals:
- Crossovers: MACD crosses Signal Line
- Zero Line Cross: Changes trend bias
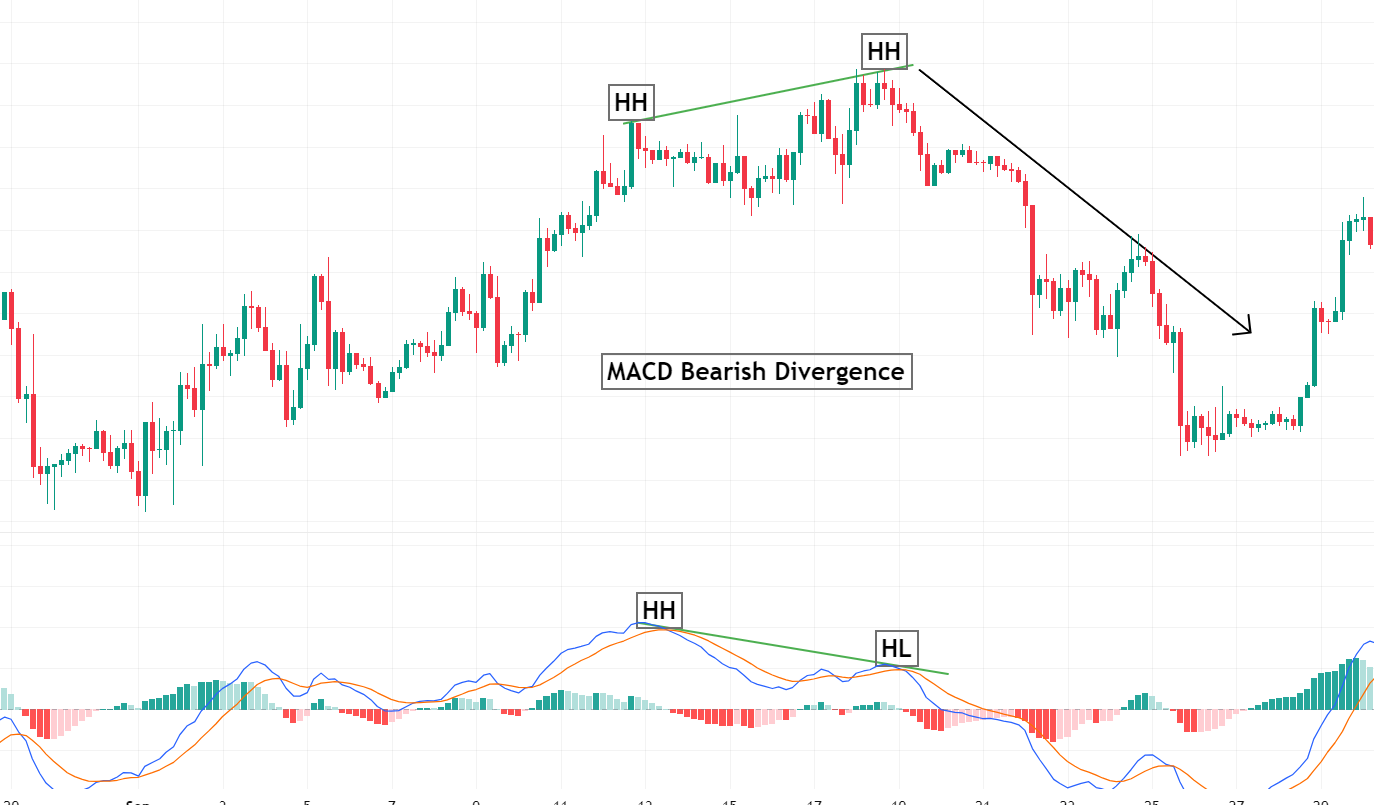
- Divergence: Price vs MACD direction
- Histogram: Momentum strength
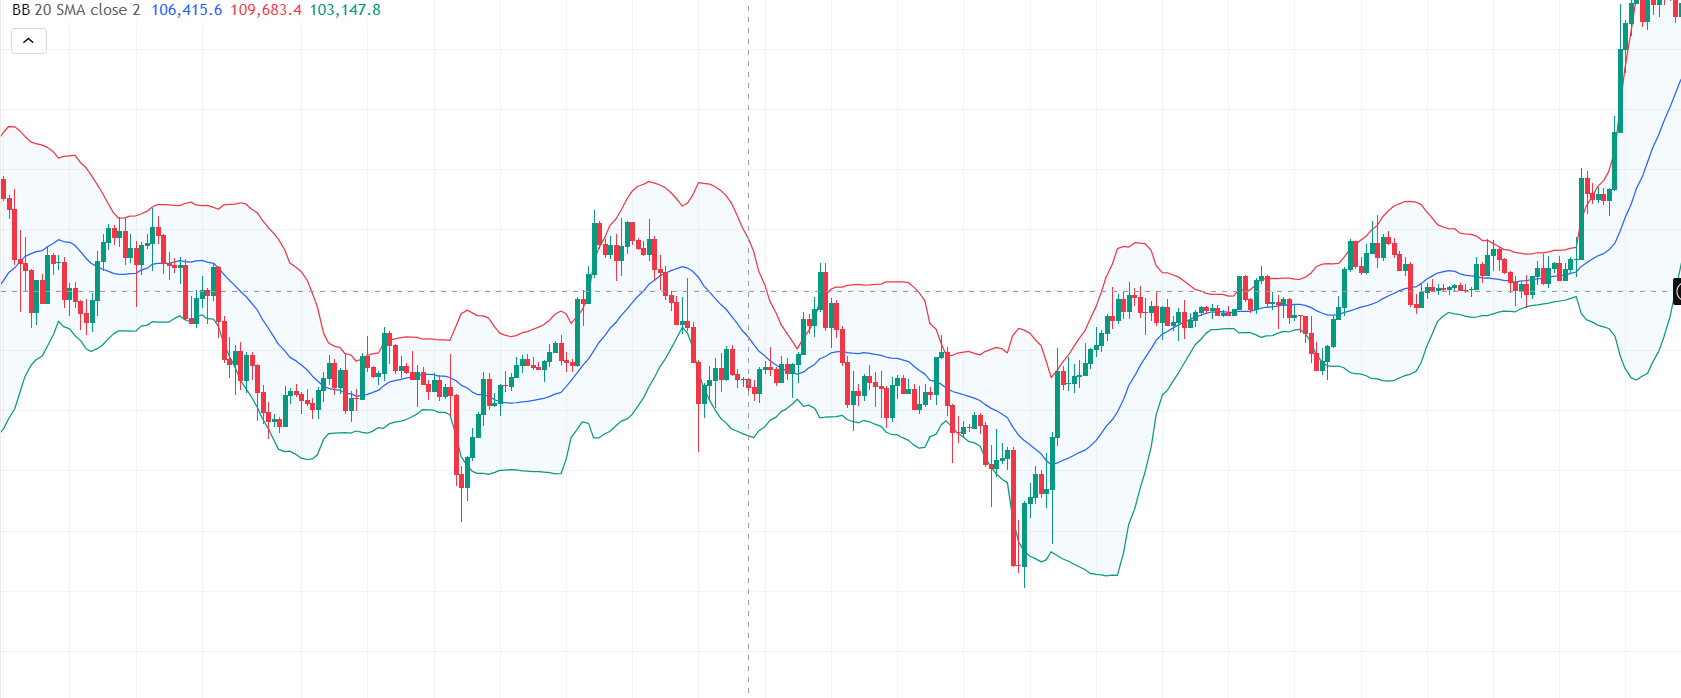
Indicator #4: Bollinger Bands
Components:
- Middle Band: 20-period SMA
- Upper Band: Middle + (2 × Std Dev)
- Lower Band: Middle - (2 × Std Dev)
- Bandwidth: Measures volatility
Key Patterns:
- Squeeze: Low volatility before breakout
- Expansion: High volatility during trends
- Walk the Band: Price rides band in strong trend
- W Bottoms/M Tops: Reversal patterns
IV. How to Combine Indicators Effectively
The Art of Indicator Confluence
✅ Good Practices:
- Mix Categories: Trend + Momentum + Volume
- Limit Quantity: 2-4 indicators maximum
- Hierarchy: Price Action > S/R > Trend > Momentum
- Confirm, Don't Predict: Use indicators to confirm, not lead
❌ Common Mistakes:
- Similar Indicators: RSI + Stochastic (both momentum)
- Overload: 10+ indicators causing confusion
- Ignoring Context: Same signal, different market conditions
- Curve Fitting: Over-optimizing to past data
Effective Indicator Combinations:
Trend Following
50 EMA + 200 EMA + MACD + Volume
Best for trending markets
Mean Reversion
RSI + Bollinger Bands + Volume
Best for ranging markets
Breakout Trading
Bollinger Squeeze + Volume + ADX
Best for volatile crypto
V. Combining Indicators with Candlestick Patterns
Bullish Hammer Confirmation
- Candle: Hammer at support
- RSI: Oversold (<30) with divergence
- Volume: Above average on hammer
- Bollinger: Price at lower band
- Probability: High bullish reversal
Bearish Engulfing Confirmation
- Candle: Engulfing at resistance
- RSI: Overbought (>70) with divergence
- MACD: Bearish crossover
- Volume: High on engulfing
- Probability: High bearish reversal
Doji with Confirmation
- Candle: Doji after strong trend
- Bollinger: Price at band extreme
- Volume: Declining (lack of conviction)
- Stochastic: Extreme with reversal
- Probability: High trend exhaustion
Step-by-Step Confluence Trading
Identify Candlestick Pattern
What pattern? Where located? Volume confirming?
Check Trend Indicators
Higher TF trend? MA alignment? ADX strength?
Analyze Momentum Indicators
RSI levels? Divergence? Momentum alignment?
Evaluate Volume & Volatility
Volume supporting? Bollinger expansion? Volatility?
Wait for Confirmation
Next candle confirms? Indicators align? Multiple confluence?
VI. Crypto-Specific Indicator Strategies
Weekend Accumulation Detection
- Time: Sunday/Monday morning (UTC)
- Indicators: Volume Profile + RSI
- Pattern: Small candles with long lower wicks
- Action: Look for accumulation at oversold RSI with volume spikes
Leverage Liquidation Plays
- Condition: Extreme volatility events
- Indicators: Bollinger Bands + ATR + Volume
- Pattern: Long-wicked candles (liquidation wicks)
- Action: Fade extreme moves when volatility shows exhaustion
Altcoin Season Detection
- Indicator: Bitcoin Dominance + RSI
- Pattern: BTC.D making lower highs with oversold RSI
- Confirmation: Altcoin volume increasing
- Action: Rotate into strong alts showing relative strength
News Event Trading
- Before News: Bollinger Squeeze + Low Volume
- During News: Volume Spike + Extreme RSI
- After News: Wait for retest of pre-news levels
- Action: Trade the retest, not the initial spike
VII. Common Indicator Mistakes in Crypto
| Mistake | Problem | Solution |
|---|---|---|
| Stock Market Settings | Crypto is 5-10x more volatile than stocks | Adjust: RSI 20/80, BB 2.5-3.0 std dev, faster MAs |
| Ignoring 24/7 Nature | Indicators assume market closes | Use Heikin-Ashi or UTC-based daily candles |
| Over-Optimization | Fitting to past data (curve fitting) | Use defaults first, test on multiple coins |
| Indicator Overload | Too many conflicting signals | Master 2-3 indicators before adding more |
| Ignoring Volume | Crypto volume can be misleading | Use multiple exchange volumes, focus on BTC/ETH |
VIII. Practical Trading Framework
Daily Trading Checklist (25 Minutes)
Step 1
Market Context
(5 min)
Step 2
Trend Analysis
(5 min)
Step 3
Candle Patterns
(5 min)
Step 4
Indicator Confluence
(5 min)
Step 5
Trade Setup
(5 min)
Example Trade Setup: Buying Bitcoin Dip
IX. Indicator Settings by Timeframe
| Timeframe | Moving Averages | RSI Settings | Other Indicators | Best For |
|---|---|---|---|---|
|
Scalping (1-15 min) |
9 EMA + 21 EMA | 10 period, 20/80 levels | BB: 2.0 std dev, Volume spikes | Quick trades, high frequency |
|
Day Trading (1-4 hour) |
20 EMA + 50 EMA | 14 period, 30/70 levels | MACD standard, 4H volume | Daily positions, swing setups |
|
Swing Trading (Daily) |
50 EMA + 200 EMA | 14 period, 30/70 levels | BB: 2.5 std dev, Volume Profile | Multi-day holds, trend following |
|
Position Trading (Weekly) |
50 SMA + 200 SMA | 21 period, 30/70 levels | MACD slower, Weekly patterns | Long-term, macro trends |
X. Building Your Indicator Toolkit
Beginner Toolkit
- 50 EMA (trend)
- RSI 14 (momentum)
- Simple Volume
- Focus: Master these first
Intermediate Toolkit
- 50 EMA + 200 EMA
- RSI + MACD
- Bollinger Bands
- Volume Profile basics
Advanced Toolkit
- Ichimoku + ADX
- RSI + Stochastic + CCI
- BB + ATR + Keltner
- VWAP + Order Flow
Professional Toolkit
- Multi-Timeframe analysis
- On-Chain + Technical
- Volume Profile + Auction
- Sentiment + Funding Rates
Conclusion
Key Principles to Remember:
📊 Indicators Confirm, Not Predict: Best used to confirm price action
🎯 Less is More: 2-4 well-chosen indicators outperform 10 conflicting ones
🌍 Context is Everything: Same signal means different things in different conditions
🔄 Adapt to Crypto: Adjust settings for crypto's unique volatility & 24/7 nature
📈 Practice Makes Permanent: Paper trade combinations before real money
⚖️ Supplementary Tool: Indicators enhance, don't replace, price action analysis
Technical indicators are powerful tools that, when combined
properly with candlestick patterns, can significantly improve your
trading accuracy. Start with the basics (MA + RSI + Volume),
master their interpretation in different market conditions, and
gradually add complexity as your experience grows. The most
successful traders use indicators as a
supplementary tool to their primary analysis of
price action and market structure. Remember that no indicator is
perfect - they all have strengths and weaknesses depending on
market conditions. Your goal is not to find a "holy grail"
indicator, but to develop a robust toolkit that helps you make
better-informed trading decisions.
Next Lesson (5.4): We'll dive deep into Moving Averages - the
most fundamental and versatile trend indicator, with specific
applications for crypto market analysis.
5.4 Moving Averages: The Ultimate Trend Indicator
Key idea
Moving Averages smooth price data to identify trends, filter market noise, and provide dynamic support/resistance levels.
Moving Averages are the most fundamental and widely used technical indicators in trading. They smooth price data to identify trends, filter market noise, and provide dynamic support/resistance levels. In crypto's volatile markets, Moving Averages are particularly valuable for distinguishing real trends from random price fluctuations.
I. What Are Moving Averages?
Basic Definition
A Moving Average (MA) is a calculation that averages a set of prices over a specific period, creating a single smooth line on the chart. As new price data becomes available, the average "moves" forward, dropping the oldest data point and adding the newest.
Core Purpose
- Trend Identification: Direction of MA indicates trend direction
- Noise Reduction: Smoothes out short-term volatility
- Dynamic Support/Resistance: Provides levels that adjust with the market
- Signal Generation: Crossovers indicate potential trend changes
II. Types of Moving Averages
Simple Moving Average (SMA)
- Calculation: Arithmetic mean of closing prices
- Characteristics: Equal weight to all prices
- Best For: Long-term trends, weekly/monthly charts
- Formula: SMA = (P1 + P2 + ... + Pn) ÷ n
- Crypto Use: Long-term investing, major trend identification
Exponential Moving Average (EMA)
- Calculation: More weight to recent prices
- Characteristics: Faster response to price changes
- Best For: Short-medium term trading
- Formula: EMA = [Close - Prev EMA] × Multiplier + Prev EMA
- Crypto Use: Day trading, swing trading crypto
| Type | Responsiveness | Smoothness | Lag | Best For Crypto |
|---|---|---|---|---|
| SMA | Low | High | High | Long-term investing, Weekly charts |
| EMA | Medium-High | Medium | Medium | Swing trading, Daily/4H charts |
III. Key Moving Average Periods in Crypto
Short-Term MAs
Intraday to Days
- 9 EMA: Scalping
- 20 EMA/SMA: Short-term trend
- 21 EMA: Fibonacci-based
- 50 EMA/SMA: Swing trading
Medium-Term MAs
Weeks to Months
- 100 EMA/SMA: Trend confirmation
- 150 EMA/SMA: Crypto alternative
- 200 EMA/SMA: "Holy Grail"
Fibonacci MAs
Popular in Crypto
- 55 EMA: Crypto communities
- 89 EMA: Fibonacci-based
- 144 EMA: Advanced traders
- 233 EMA: BTC cycles
Bitcoin Special
Historical Patterns
- 200 Weekly SMA: Most important level
- 20 Weekly EMA: Bull market support
- 50 Weekly EMA: Correction phases
IV. Practical Applications in Crypto Trading
Application 1: Trend Identification
Basic Rule:
- Price above MA = Uptrend
- Price below MA = Downtrend
- Multiple MAs aligned = Strong trend
- MAs tangled = Ranging market
Crypto-Specific Insight:
- In bull markets, price often stays above 20 EMA for extended periods
- Breaking below 50 EMA often signals correction phase
- 200 SMA acts as major support/resistance in all timeframes
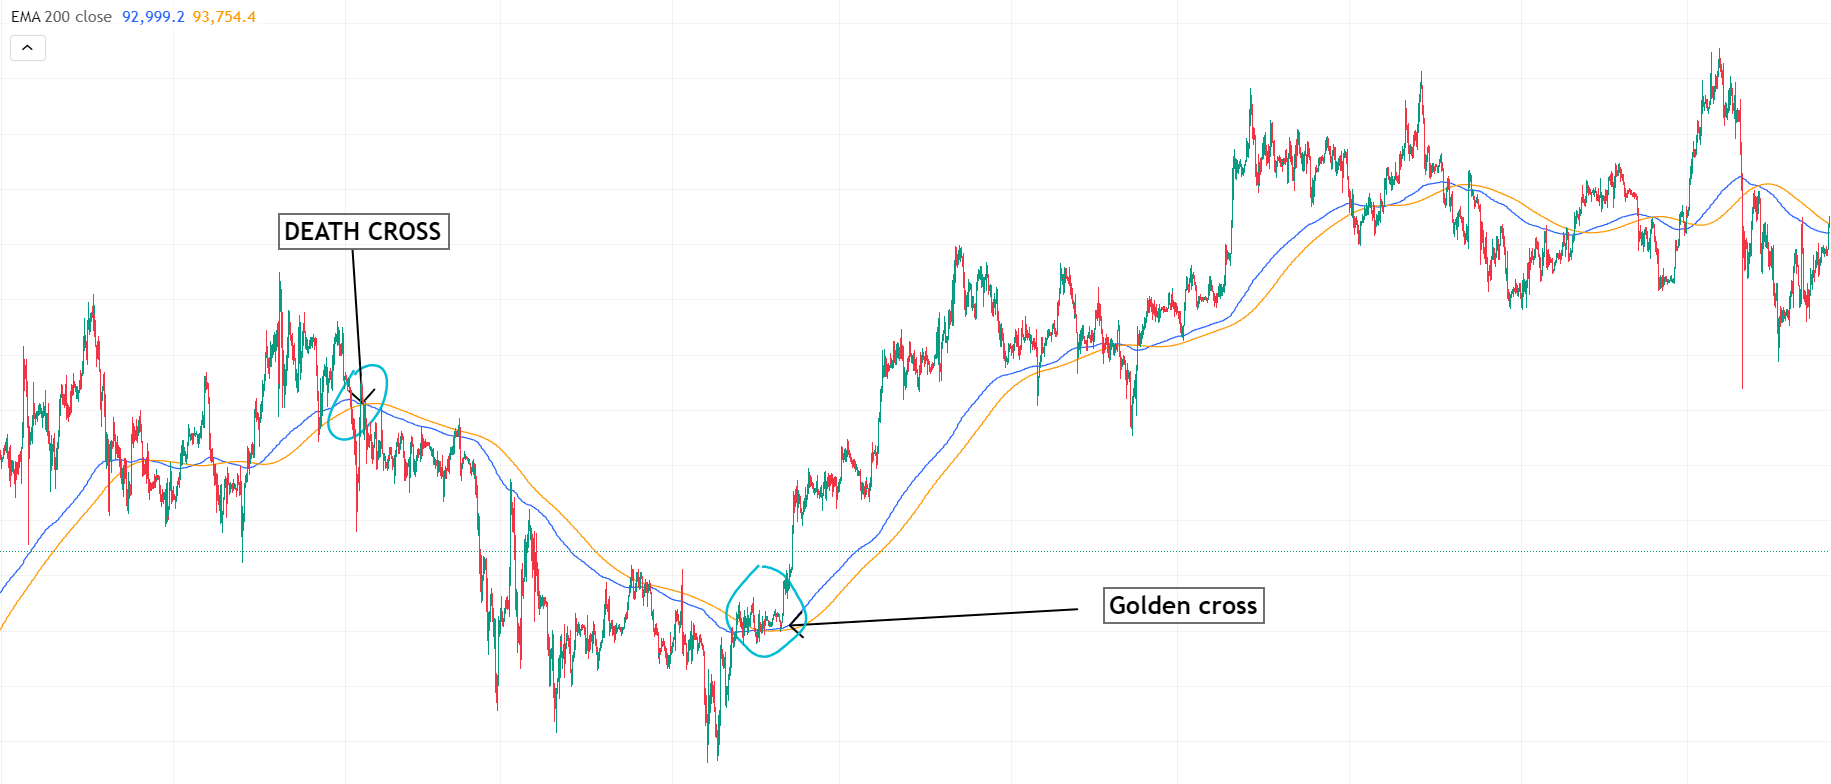
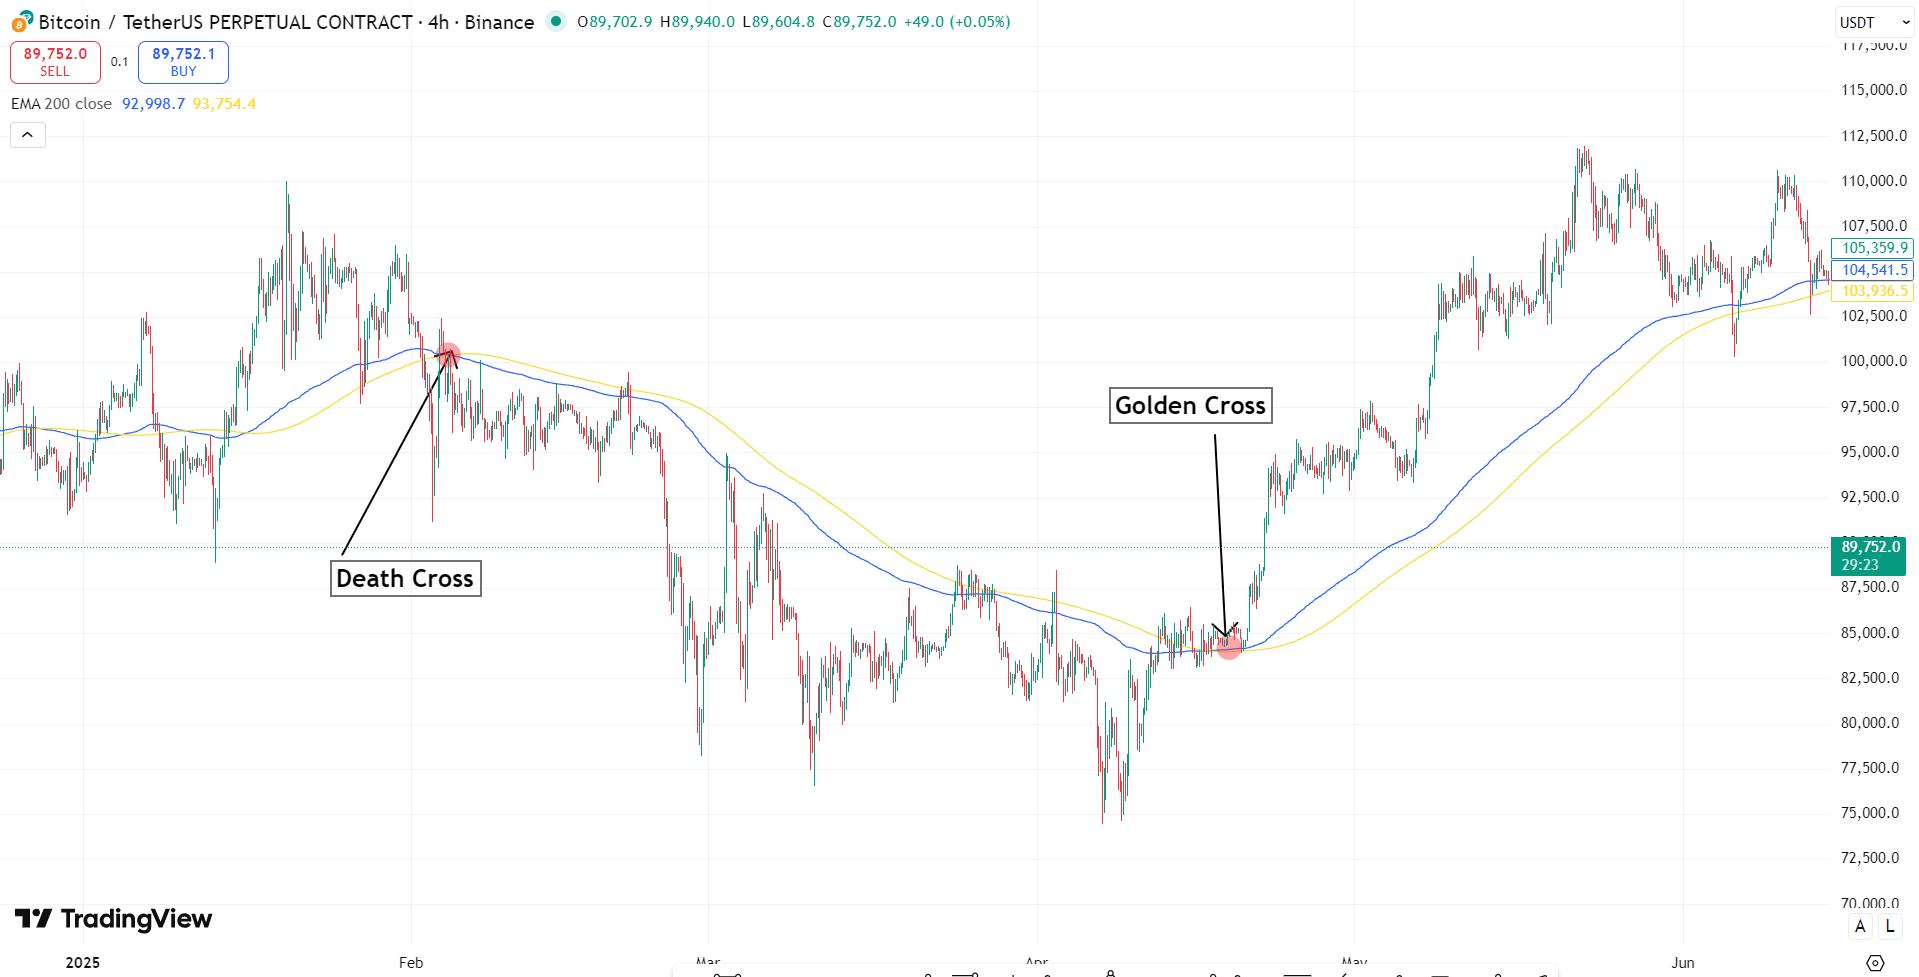
Application 2: Moving Average Crossovers
Golden Cross
- Signal: Shorter MA crosses above longer MA
- Example: 50 EMA crosses above 200 EMA
- Meaning: Bullish, precedes major rallies
- Crypto Tip: More reliable on weekly charts
Death Cross
- Signal: Shorter MA crosses below longer MA
- Example: 50 EMA crosses below 200 EMA
- Meaning: Bearish, precedes extended downtrends
- Crypto Tip: Watch for false signals in volatile markets
V. Crypto-Specific Moving Average Strategies
Strategy 1: The 20-50 EMA Swing Strategy
- Timeframe: 4H and Daily charts
-
Rules:
- Both 20 and 50 EMA trending upward
- Price pulls back to 20 EMA (entry)
- Stop loss below 50 EMA
- Take profit at next resistance
- Exit when 20 EMA crosses below 50 EMA
- Success Rate: 60-70% in trending markets
- Best For: Trending altcoins, BTC during bull runs
Strategy 2: Weekly 200 SMA Reversal
- Timeframe: Weekly charts
-
Rules:
- Price approaches 200 SMA after extended move
- Look for reversal candlestick patterns
- Volume confirmation required
- Entry on break of reversal pattern
- Stop loss beyond 200 SMA
- Historical: Bitcoin has always respected 200 SMA on weekly
- Best For: Major trend reversals, long-term positions
VI. Bitcoin's Relationship with 200 Weekly SMA
Historical Patterns
- 2013-2014: 200 SMA acted as ultimate bear market bottom
- 2015-2017: 200 SMA supported entire bull market
- 2018-2019: 200 SMA contained bear market rallies
- 2020-2021: 200 SMA launched COVID bull run
- 2022-2023: 200 SMA tested as bear market support
Trading Implication:
200 Weekly SMA is arguably the most important level in crypto. Every major trend change has involved this level.
VII. Common Moving Average Mistakes in Crypto
| Mistake | Problem | Solution |
|---|---|---|
| Using Stock Market Periods | Crypto is 5-10x more volatile than stocks | Use faster periods (20 EMA instead of 50 SMA) |
| Ignoring Timeframe Context | Trading against higher timeframe MAs | Always check weekly MA position first |
| Chasing Extended Moves | Buying when price far above MA | Wait for pullbacks to MAs in uptrends |
Conclusion
Key Takeaways:
📊 EMA for Speed, SMA for Significance: Use EMA for entries/exits, SMA for major trend bias
🌍 Multi-Timeframe Alignment: Always check higher timeframe MAs before trading
🔄 Combine, Don't Isolate: MAs work best with other indicators and price action
⚡ Adapt to Crypto: Adjust periods and types for crypto's unique volatility
Next Lesson (5.5): We'll explore the RSI indicator in depth—how to use it effectively in crypto's volatile environment.
5.5 RSI: The Ultimate Momentum Indicator
Key idea
RSI measures the speed and magnitude of price movements to identify overbought/oversold conditions and spot divergences before reversals.
The Relative Strength Index (RSI) is one of the most versatile and widely used momentum indicators in trading. Developed by J. Welles Wilder in 1978, RSI measures the speed and magnitude of price movements to identify overbought and oversold conditions. In crypto's volatile markets, RSI is particularly valuable for spotting reversals, divergences, and momentum shifts before they appear on price charts.
I. What Is the Relative Strength Index?
Basic Definition
RSI is a momentum oscillator that measures the magnitude of recent price changes to evaluate overbought or oversold conditions. It oscillates between 0 and 100, providing clear visual signals about market momentum.
Key Formula:
RSI = 100 - [100 ÷ (1 + RS)]
Where RS = Average Gain ÷ Average Loss
Over specified periods (typically 14)
Core Purpose
- Identify Overbought/Oversold: Spot extreme market conditions
- Detect Divergences: Spot reversals before price confirms
- Trend Confirmation: Above/below 50 line indicates trend direction
- Momentum Measurement: Gauge strength of price movements
II. Key RSI Levels & Interpretation
Oversold Zone
0 - 30
- Meaning: Potential buying opportunity
- Action: Consider long positions
- Crypto Adjust: Use 20 for conservative
Neutral Lower
30 - 50
- Meaning: Mild bearish momentum
- Action: Wait for confirmation
- Trend: Below 50 = Bearish bias
Neutral Upper
50 - 70
- Meaning: Mild bullish momentum
- Action: Trend following
- Trend: Above 50 = Bullish bias
Overbought Zone
70 - 100
- Meaning: Potential selling opportunity
- Action: Consider short positions
- Crypto Adjust: Use 80 for conservative
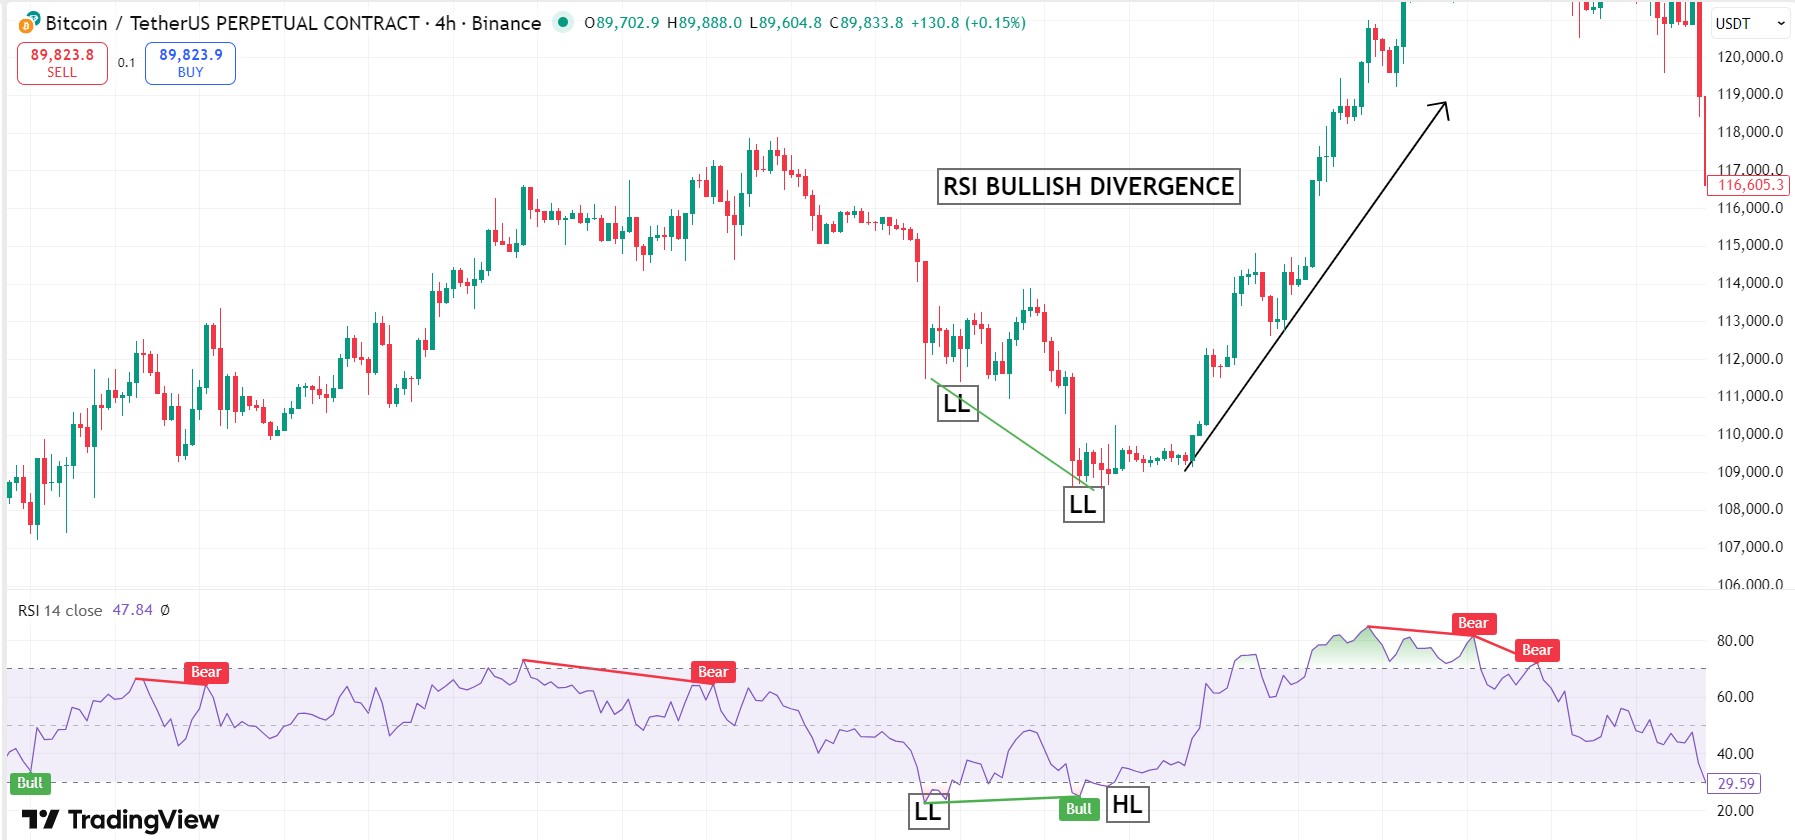
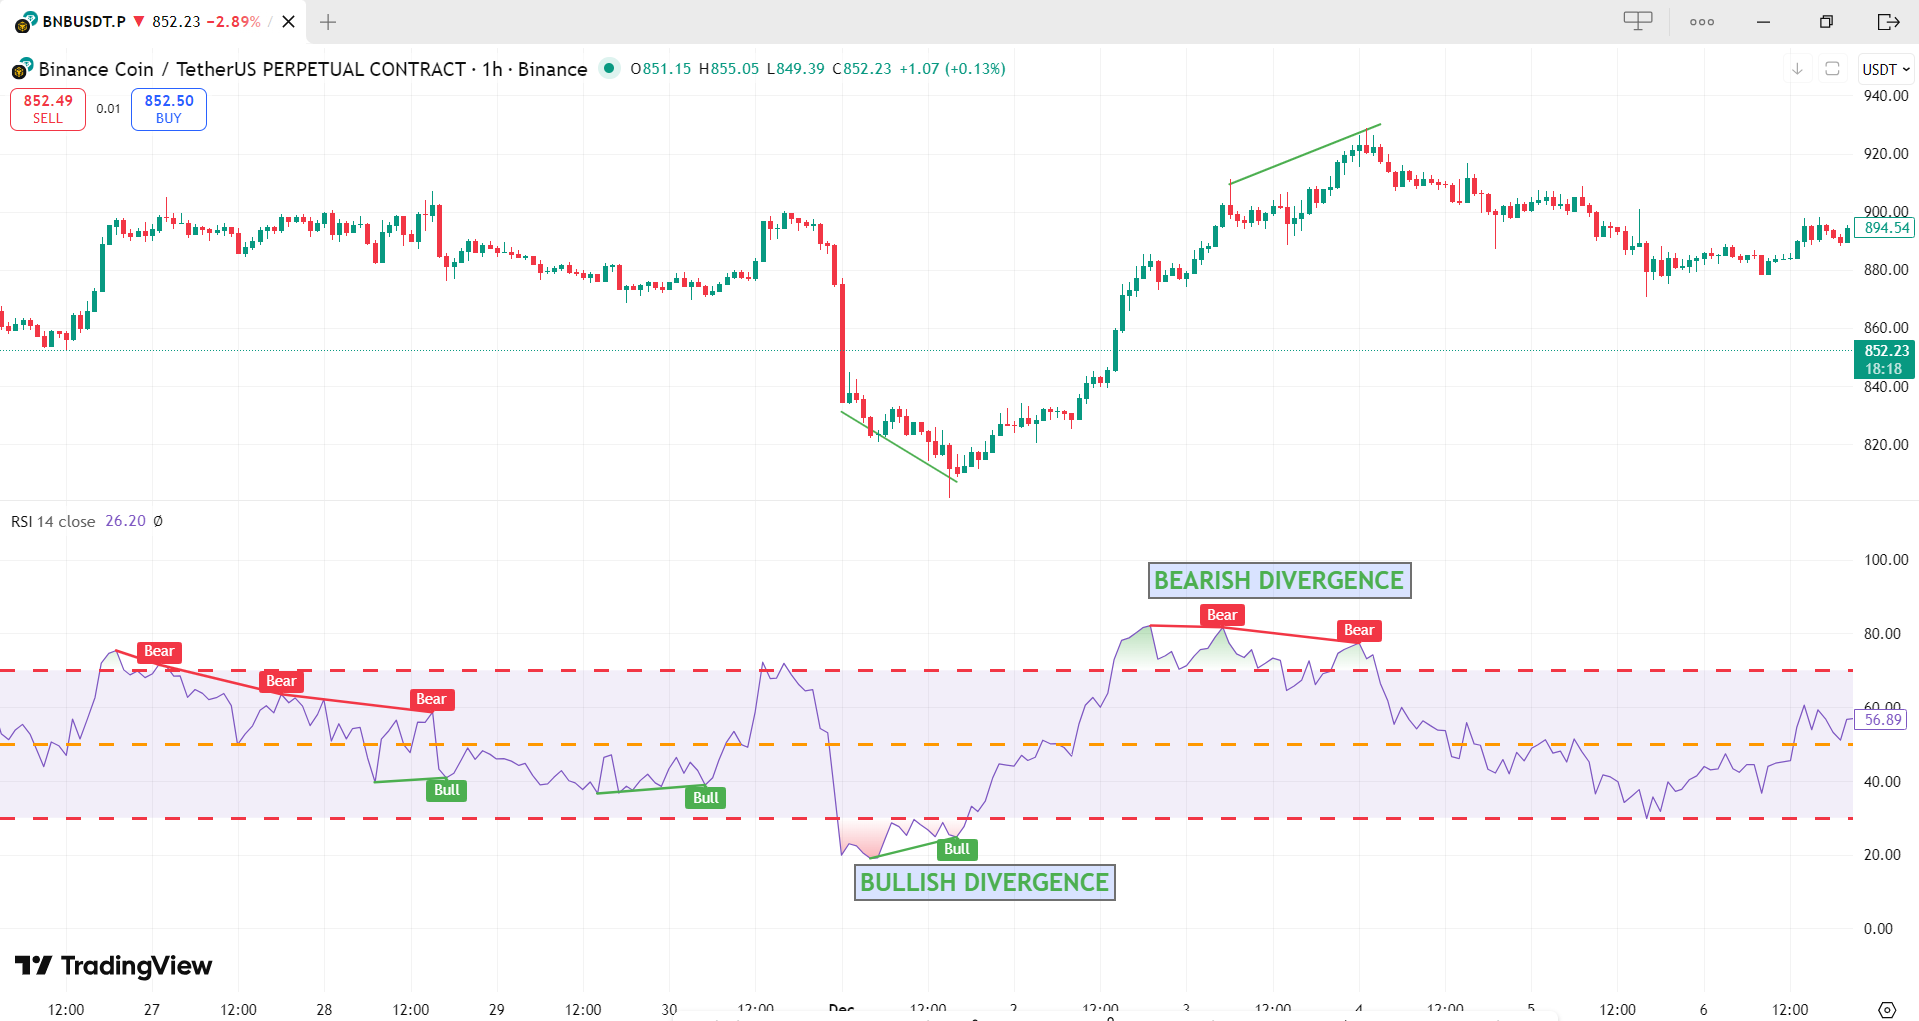
III. RSI Divergences: The Ultimate Reversal Signal
Bullish Divergence
Price Action
Price makes a lower low
RSI Action
RSI makes a higher low
Interpretation
Selling pressure weakening despite lower prices
Signal
Potential bullish reversal coming
Bearish Divergence
Price Action
Price makes a higher high
RSI Action
RSI makes a lower high
Interpretation
Buying momentum weakening despite higher prices
Signal
Potential bearish reversal coming
IV. RSI Settings Optimized for Crypto
| Trading Style | Period | Overbought | Oversold | Best For Crypto |
|---|---|---|---|---|
|
Scalping (1-15 min) |
7-10 | 75-80 | 20-25 | Quick reversals, high volatility pairs |
|
Day Trading (1-4 hour) |
14 (standard) | 70-75 | 25-30 | Most crypto pairs, balanced sensitivity |
|
Swing Trading (Daily) |
14-21 | 65-70 | 30-35 | BTC, ETH, major altcoins |
V. Combining RSI with Moving Averages
The Ultimate Confluence Strategy
Entry Conditions (Long):
- Price above 50 EMA (uptrend)
- Price pulls back to 20 EMA (support)
- RSI shows oversold (<30) or bullish divergence
- RSI crosses back above 30 (momentum shift)
- Volume increases on bounce
Entry Conditions (Short):
- Price below 50 EMA (downtrend)
- Price rallies to 20 EMA (resistance)
- RSI shows overbought (>70) or bearish divergence
- RSI crosses back below 70 (momentum shift)
- Volume increases on rejection
Conclusion
Key RSI Principles for Crypto:
📊 Divergences Over Levels: RSI divergences are more reliable than overbought/oversold levels alone
🌍 Context Matters: RSI at 30 means different things in uptrend vs downtrend
🔄 Adjust for Volatility: Crypto needs different RSI settings than stocks
⚡ Multi-Timeframe Analysis: Check RSI on higher timeframes first
Next Lesson (5.6): We'll explore MACD—how to combine trend and momentum analysis for powerful trading systems.
5.6 MACD: The Ultimate Trend & Momentum Combo
Key idea
MACD combines trend-following and momentum characteristics, showing both trend direction and momentum strength in a single oscillator.
The Moving Average Convergence Divergence (MACD) is one of the most versatile indicators in technical analysis. Created by Gerald Appel in the late 1970s, MACD combines trend-following and momentum characteristics into a single oscillator. In crypto trading, MACD's ability to show both trend direction and momentum strength makes it invaluable for identifying entry points, trend changes, and potential reversals.
I. What Is MACD?
Basic Definition
MACD is a trend-following momentum indicator that shows the relationship between two moving averages of a security's price. It consists of three components: the MACD line, Signal line, and Histogram, each providing different information about market conditions.
Key Formula:
MACD Line = 12-period EMA - 26-period EMA
Signal Line = 9-period EMA of MACD Line
Histogram = MACD Line - Signal Line
Core Purpose
- Trend Identification: MACD above/below zero indicates trend
- Momentum Measurement: Histogram shows momentum strength
- Signal Generation: Crossovers provide entry/exit signals
- Divergence Detection: Spot reversals before price confirms
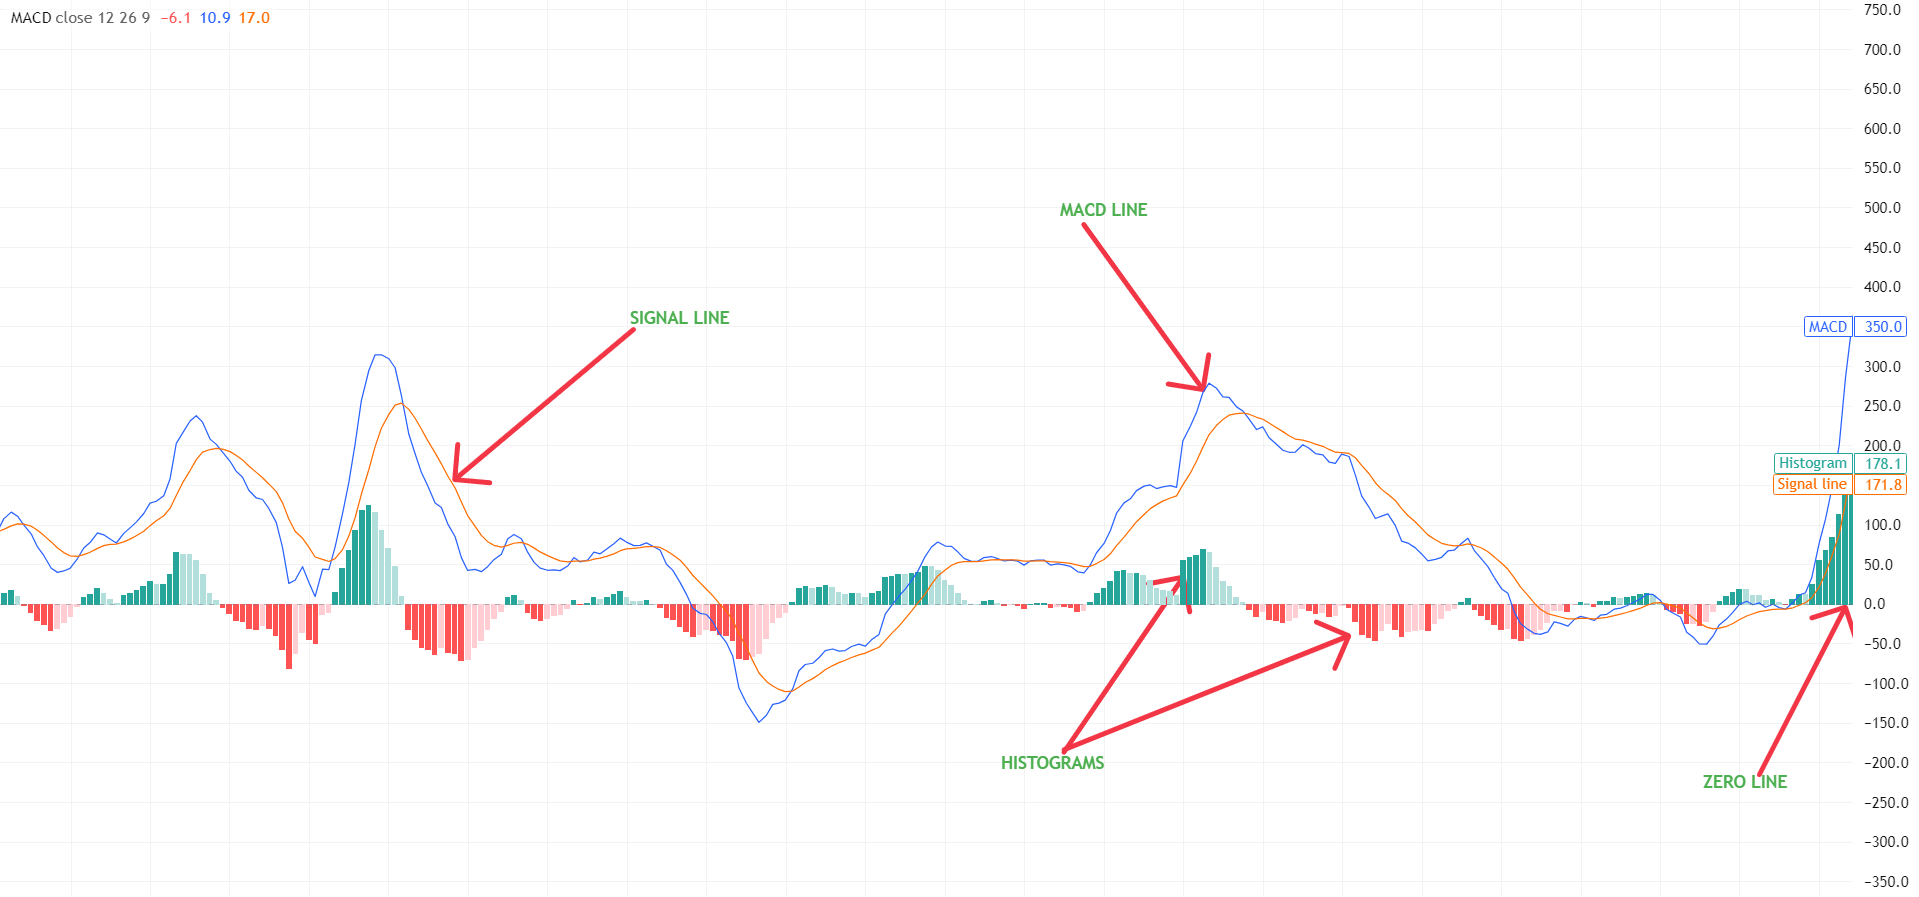
II. MACD Components Explained
MACD Line
(12 EMA - 26 EMA)
- Function: Primary trend indicator
- Above Zero: Bullish trend
- Below Zero: Bearish trend
- Steep Slope: Strong momentum
Signal Line
(9 EMA of MACD Line)
- Function: Trigger for trades
- MACD > Signal: Bullish signal
- MACD < Signal: Bearish signal
- Crossovers: Entry/exit points
Histogram
(MACD - Signal)
- Function: Momentum strength
- Above Zero: Bullish momentum
- Below Zero: Bearish momentum
- Increasing: Momentum strengthening
III. Key MACD Signals & Interpretations
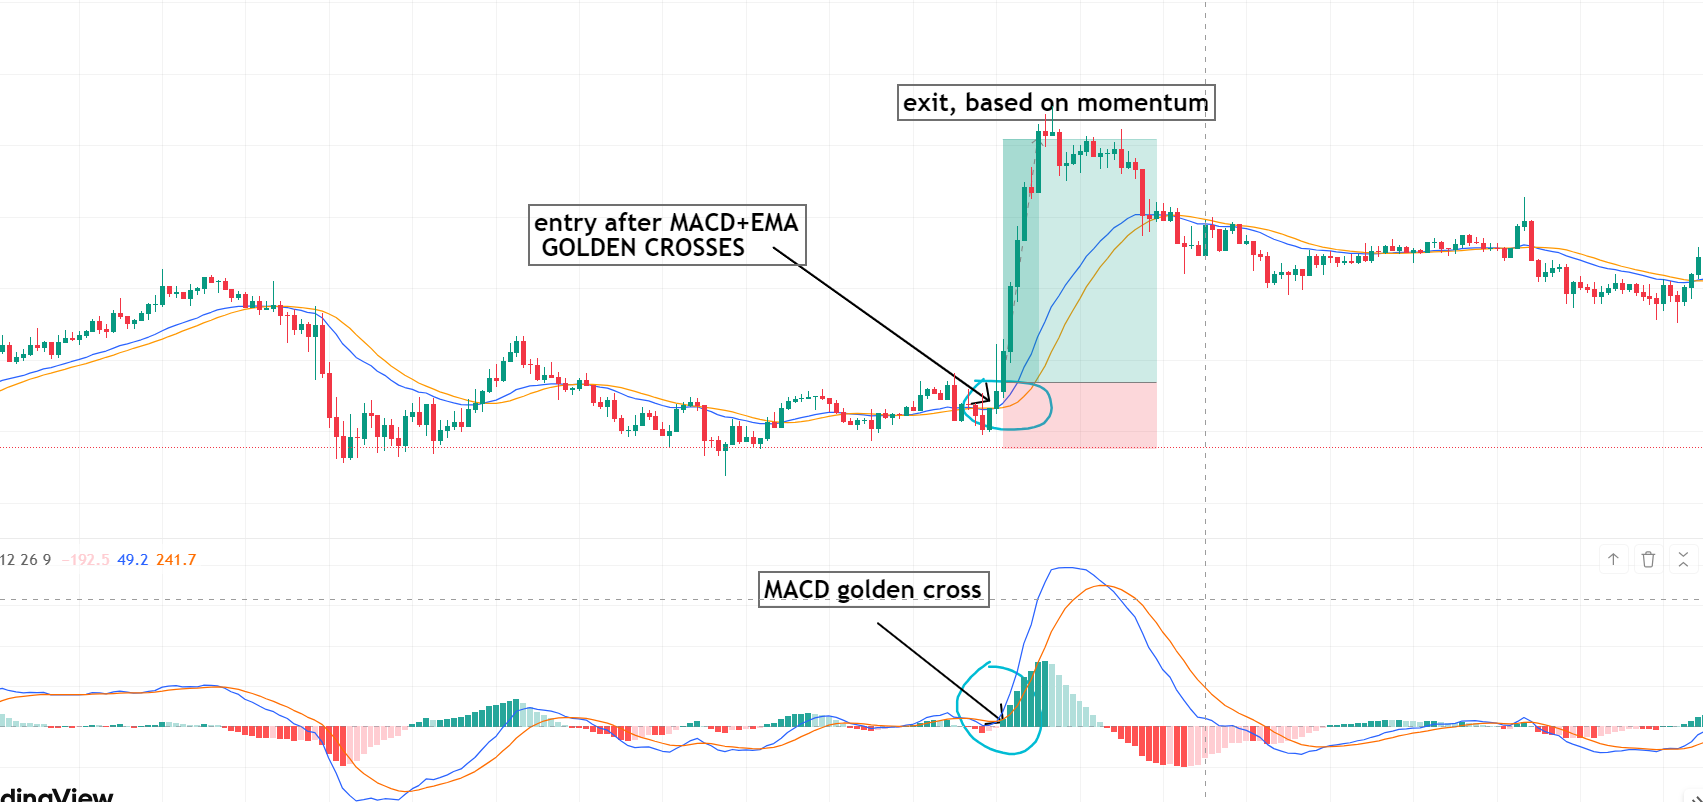
Bullish MACD Signals
MACD Crossover
MACD line crosses above Signal line
Zero Line Cross
MACD crosses above zero line
Bullish Divergence
Price lower low, MACD higher low
Bearish MACD Signals
MACD Crossover
MACD line crosses below Signal line
Zero Line Cross
MACD crosses below zero line
Bearish Divergence
Price higher high, MACD lower high
IV. MACD Settings Optimized for Crypto
| Trading Style | Fast EMA | Slow EMA | Signal | Best For Crypto |
|---|---|---|---|---|
|
Scalping (1-15 min) |
8 | 17 | 9 | Quick signals, high volatility pairs |
|
Day Trading (1-4 hour) |
12 | 26 | 9 | Standard, balanced for most crypto |
|
Swing Trading (Daily) |
21 | 55 | 13 | BTC, ETH, major trends |
V. MACD Divergences: The Ultimate Reversal Tool
Regular vs Hidden Divergences
Regular Bullish Divergence
Price makes lower low, MACD makes higher low
Signal: Potential trend reversal UP
Regular Bearish Divergence
Price makes higher high, MACD makes lower high
Signal: Potential trend reversal DOWN
VI. Combining MACD with RSI & Moving Averages
The Triple Confirmation System
Moving Averages
- 50 EMA: Medium-term trend
- 200 SMA: Long-term bias
- Role: Foundation, trend filter
RSI
- Overbought/Oversold: 70/30 levels
- Divergences: Early reversal signals
- Role: Timing, entry precision
MACD
- Crossovers: Entry/exit signals
- Histogram: Momentum strength
- Role: Confirmation, strength measurement
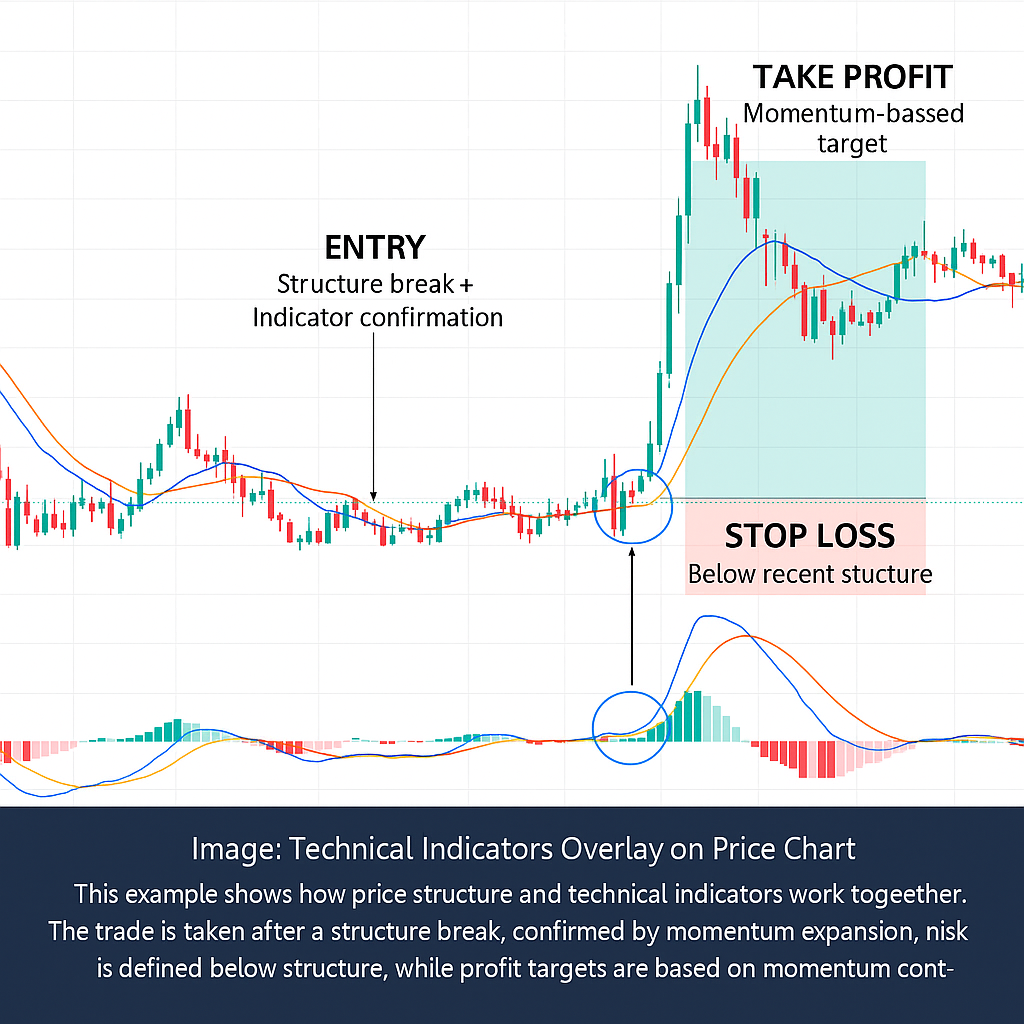
Perfect Entry Example (Long):
Price > 50 EMA (trend up) + RSI oversold with bullish divergence (timing) + MACD bullish crossover with rising histogram (confirmation) = High probability trade with multiple confirmations.
VII. Crypto-Specific MACD Strategies
Strategy 1: MACD Zero Line Bounce
Setup
MACD approaches zero line in uptrend
Entry
MACD bullish crossover at zero line
Management
Stop below recent low, target previous high
Strategy 2: MACD Divergence Reversal
Setup
Spot regular divergence at key S/R
Entry
Price breaks short-term trendline
Management
Wider stops, larger targets (1:5+ R/R)
VIII. Common MACD Mistakes in Crypto
| Mistake | Why It's Wrong in Crypto | Solution |
|---|---|---|
| Trading Every Crossover | MACD whipsaws frequently in crypto ranges | Only trade crossovers in trending markets |
| Default Settings Only | 12,26,9 is too slow for crypto volatility | Adjust settings based on timeframe and asset |
Conclusion
Key MACD Principles for Crypto:
📊 Three Components, Three Signals: MACD line = trend, Signal line = triggers, Histogram = momentum
🌍 Context is Crucial: MACD above/below zero changes everything
🎯 Divergences Are Powerful: MACD divergences often precede major moves
⚡ Combine with RSI & MAs: Triple confirmation = Highest probability trades
Next Lesson (5.7): We'll explore Volume indicators—the ultimate confirmation tool for breakouts and reversals.
5.7 Volume Indicators: The Ultimate Market Truth
Key idea
Volume is the "fuel" that drives price movements. While price tells you WHAT is happening, volume tells you HOW STRONGLY it's happening.
Volume is often called the "fuel" that drives price movements. While price tells you WHAT is happening, volume tells you HOW STRONGLY it's happening and WHETHER it's likely to continue. In crypto markets, where manipulation and fakeouts are common, volume analysis provides the truth behind price movements, separating real breakouts from false signals and identifying accumulation/distribution patterns.
I. Why Volume Analysis is Critical in Crypto
The Volume Philosophy
Volume represents the total number of contracts or shares traded during a given period. In crypto, it represents the amount of cryptocurrency traded. High volume validates price movements, while low volume suggests weak conviction.
Crypto Volume Truth:
"Price can lie, but volume never lies."
Smart money reveals itself through volume patterns before
moving price.
Core Volume Principles
- Confirmation: Volume confirms price trends and breakouts
- Exhaustion: Volume spikes often signal trend exhaustion
- Manipulation Detection: Low volume pumps are often traps
- Institutional Activity: Large volume = smart money involvement
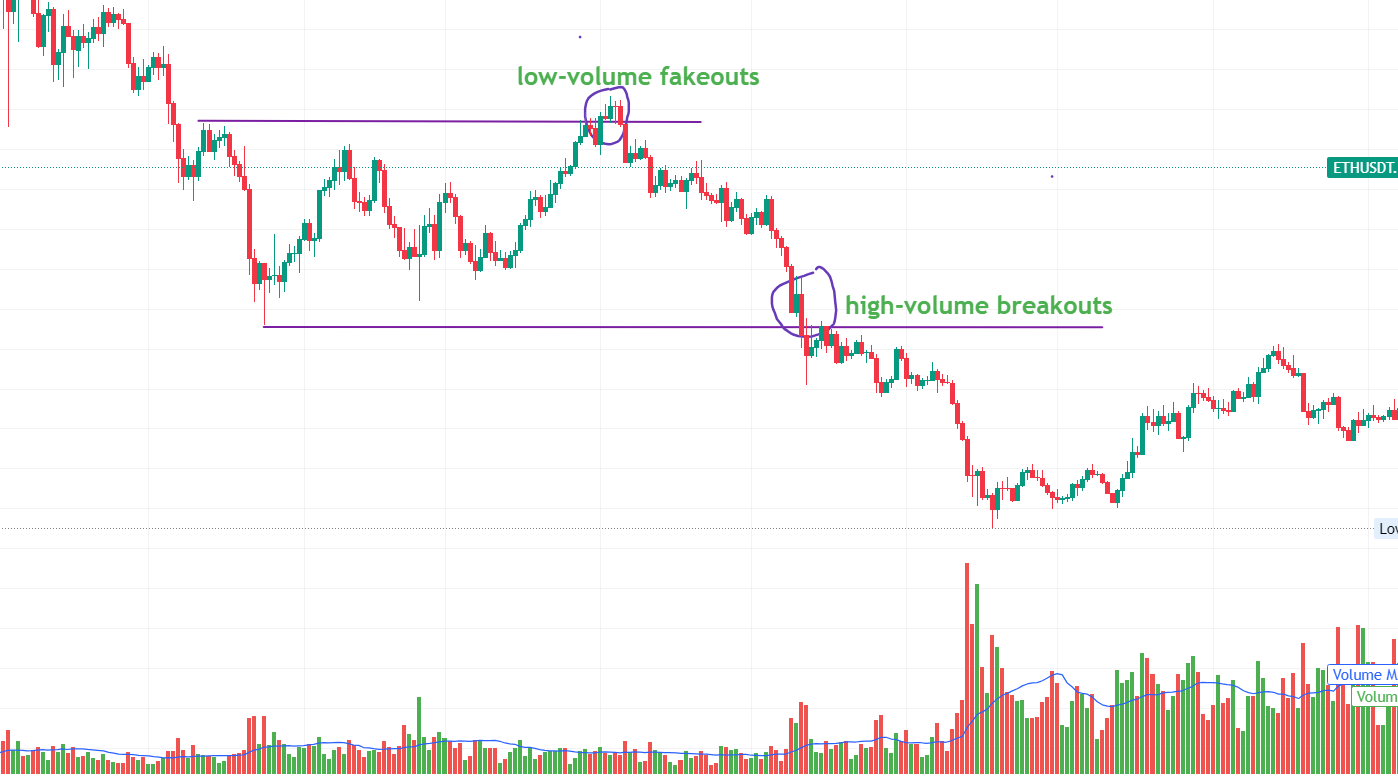
II. Basic Volume Analysis Rules
Bullish Volume Signals
Uptrend Confirmation
Volume increases as price rises
Breakout Validation
Price breaks resistance with high volume
Selling Exhaustion
High volume drop, then reversal
Bearish Volume Signals
Downtrend Confirmation
Volume increases as price falls
Breakdown Validation
Price breaks support with high volume
Buying Exhaustion
High volume rally, then reversal
III. Key Volume Indicators for Crypto
Volume Profile
- What: Volume at specific price levels
- Shows: High volume nodes (support/resistance)
- Best For: Finding fair value, key levels
- Crypto Edge: Identifies accumulation/distribution zones
On-Balance Volume (OBV)
- What: Cumulative volume indicator
- Shows: Smart money flow direction
- Best For: Trend confirmation, divergence
- Crypto Edge: Spots accumulation before price moves
VWAP
- What: Volume-Weighted Average Price
- Shows: Fair value for the trading session
- Best For: Intraday trading, institutional levels
- Rule: Price above VWAP = bullish, below = bearish
IV. Combining Volume with Technical Indicators
The Ultimate Confirmation System
Volume + Moving Averages
- Setup: Price at key MA (20, 50, 200)
- Confirmation: Volume spike on bounce/rejection
- Signal: High probability reversal
Volume + RSI
- Setup: RSI oversold/overbought
- Confirmation: Volume shows exhaustion
- Signal: Validated reversal
Volume + MACD
- Setup: MACD crossover or divergence
- Confirmation: Volume supports momentum shift
- Signal: Strong trend change
V. Practical Volume Trading Strategies
Strategy 1: Volume Breakout Confirmation
Strategy 2: Volume Exhaustion Reversal
VI. Conclusion
Key Volume Principles for Crypto:
📊 Volume Confirms Price: Price moves without volume are suspect and often reverse
🌍 Smart Money Leaves Footprints: Institutional activity reveals itself through volume patterns
🎯 Volume Precedes Price: Volume often spikes before major price movements
⚡ Combine for Maximum Edge: Volume + Price Action + Other Indicators = Highest probability
Next Lesson (5.8): We'll explore Support & Resistance—the foundational concept that underpins all price action trading.
5.8 Support & Resistance: The Foundation of Price Action
Key idea
Support and Resistance are the most fundamental concepts in technical analysis—price levels where the battle between buyers and sellers creates reaction zones.
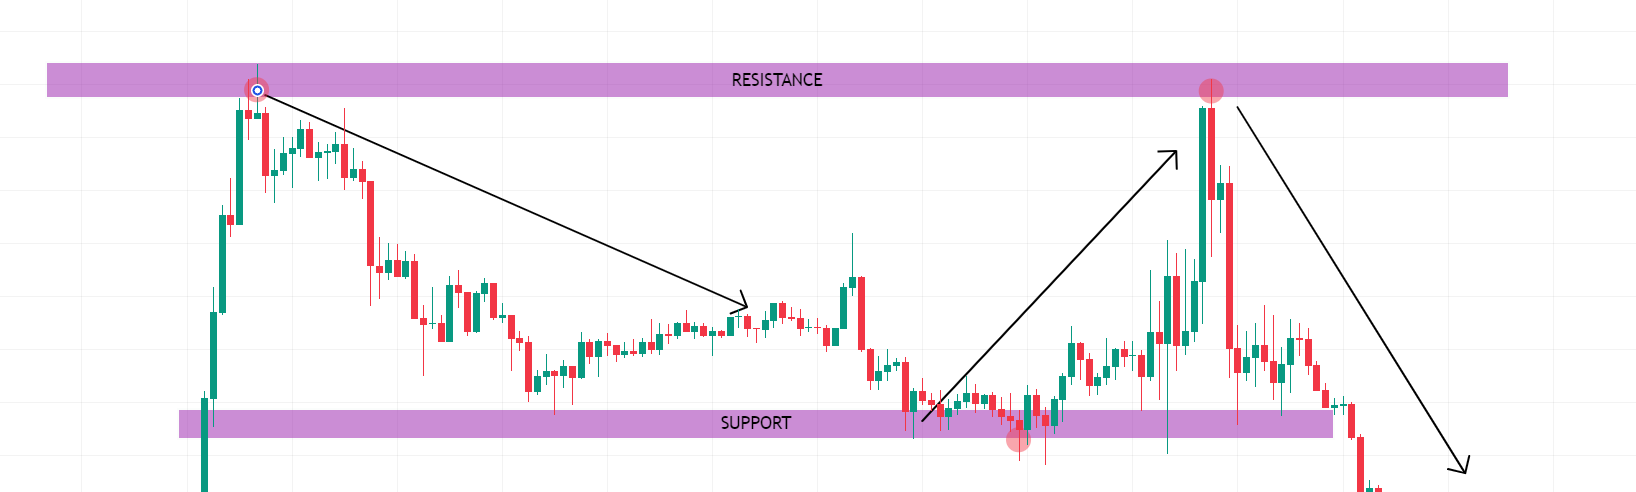
Support and Resistance are the most fundamental concepts in technical analysis. While indicators help us understand market conditions, Support & Resistance levels tell us WHERE price is likely to react. These psychological and technical price levels represent the ongoing battle between buyers and sellers, creating zones where price decisions are made. In crypto's volatile markets, mastering S/R is essential for identifying high-probability entry points, setting stops, and managing risk.
I. What Are Support & Resistance?
Basic Definitions
Support
A price level where buying interest is sufficiently strong to overcome selling pressure. It's a "floor" that prevents price from falling further.
Resistance
A price level where selling interest is sufficiently strong to overcome buying pressure. It's a "ceiling" that prevents price from rising further.
Core Principles
- Psychology: Levels represent collective market memory
- Self-Fulfillment: Traders act at known levels, creating reactions
- Role Reversal: Broken resistance becomes support, and vice versa
- Timeframe Dependency: Levels strengthen with more touches and time
II. Types of Support & Resistance
Horizontal S/R
- Definition: Static price levels
- Forms at: Previous highs/lows, consolidation areas
- Strength: More touches = stronger level
- Trading: Buy at support, sell at resistance
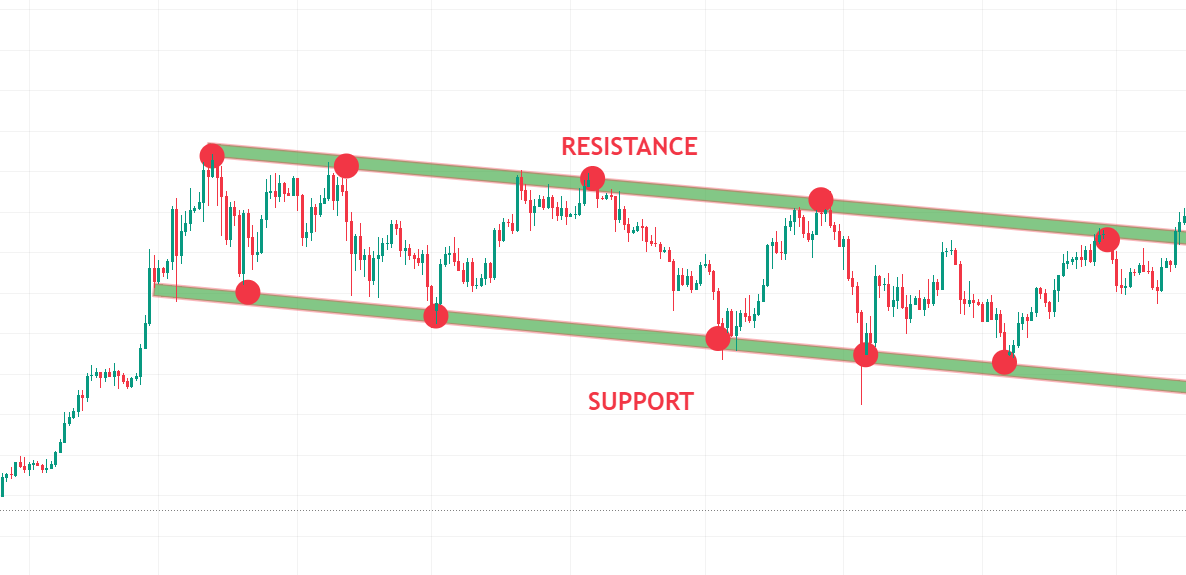
Dynamic S/R
- Definition: Moving levels (trendlines, MAs)
- Forms at: Trendlines, moving averages
- Strength: Adjusts with market momentum
- Trading: Ride trends, add on pullbacks
Psychological S/R
- Definition: Round numbers, milestones
- Forms at: $10, $100, $1,000 levels
- Strength: Retail trader concentration
- Trading: Watch for reactions at round numbers
III. How to Identify Key Support & Resistance Levels
The 5-Step S/R Identification Process
Start with Higher Timeframes
Weekly → Daily → 4H. Higher TF levels are more significant.
Mark Previous Swing Highs/Lows
Every significant peak and trough creates potential S/R.
Identify Consolidation Areas
Price ranges where market spent considerable time create strong S/R zones.
Note Round Numbers
$1,000, $10,000, $50,000 levels. Crypto retail traders love round numbers.
Add Moving Averages
20, 50, 200 EMAs often act as dynamic S/R during trends.
IV. Trading Bounces at Support & Resistance
Trading Support Bounces (Buying)
Identify Strong Support
Multiple touches, higher timeframe, confluence
Look for Reversal Signals
Bullish candlestick patterns (hammer, engulfing), RSI oversold, volume spike
Entry & Risk Management
Enter on confirmation, stop below support, target next resistance
Trading Resistance Rejections (Selling)
Identify Strong Resistance
Multiple rejections, higher timeframe, confluence
Look for Reversal Signals
Bearish candlestick patterns (shooting star, engulfing), RSI overbought, volume spike
Entry & Risk Management
Enter on confirmation, stop above resistance, target next support
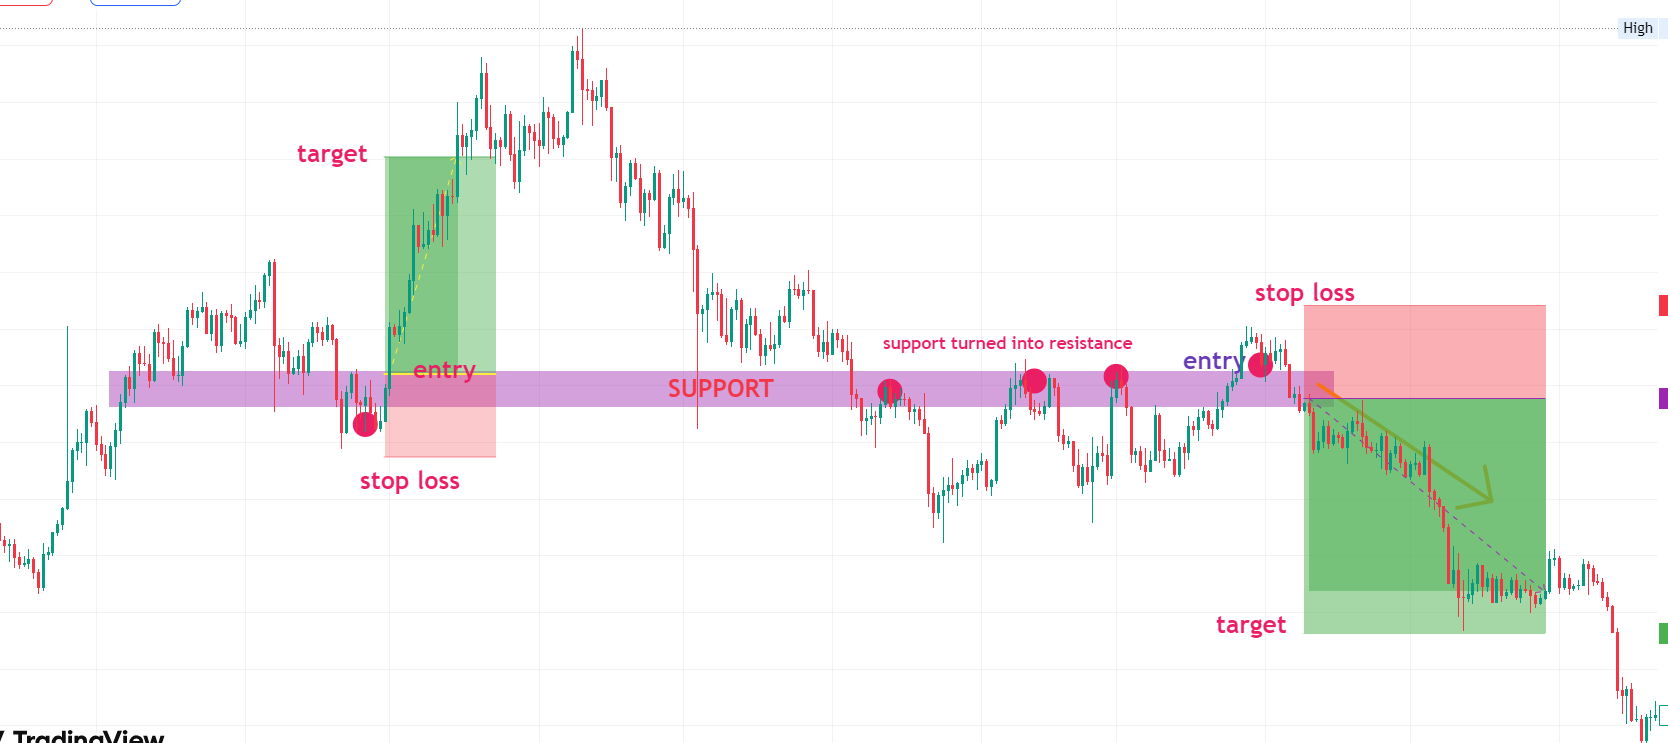
V. Role Reversal: The Most Important S/R Concept
How Role Reversal Works
Resistance Becomes Support
When price breaks ABOVE resistance with conviction, that resistance level becomes new support.
Support Becomes Resistance
When price breaks BELOW support with conviction, that support level becomes new resistance.
VI. Combining S/R with Technical Indicators
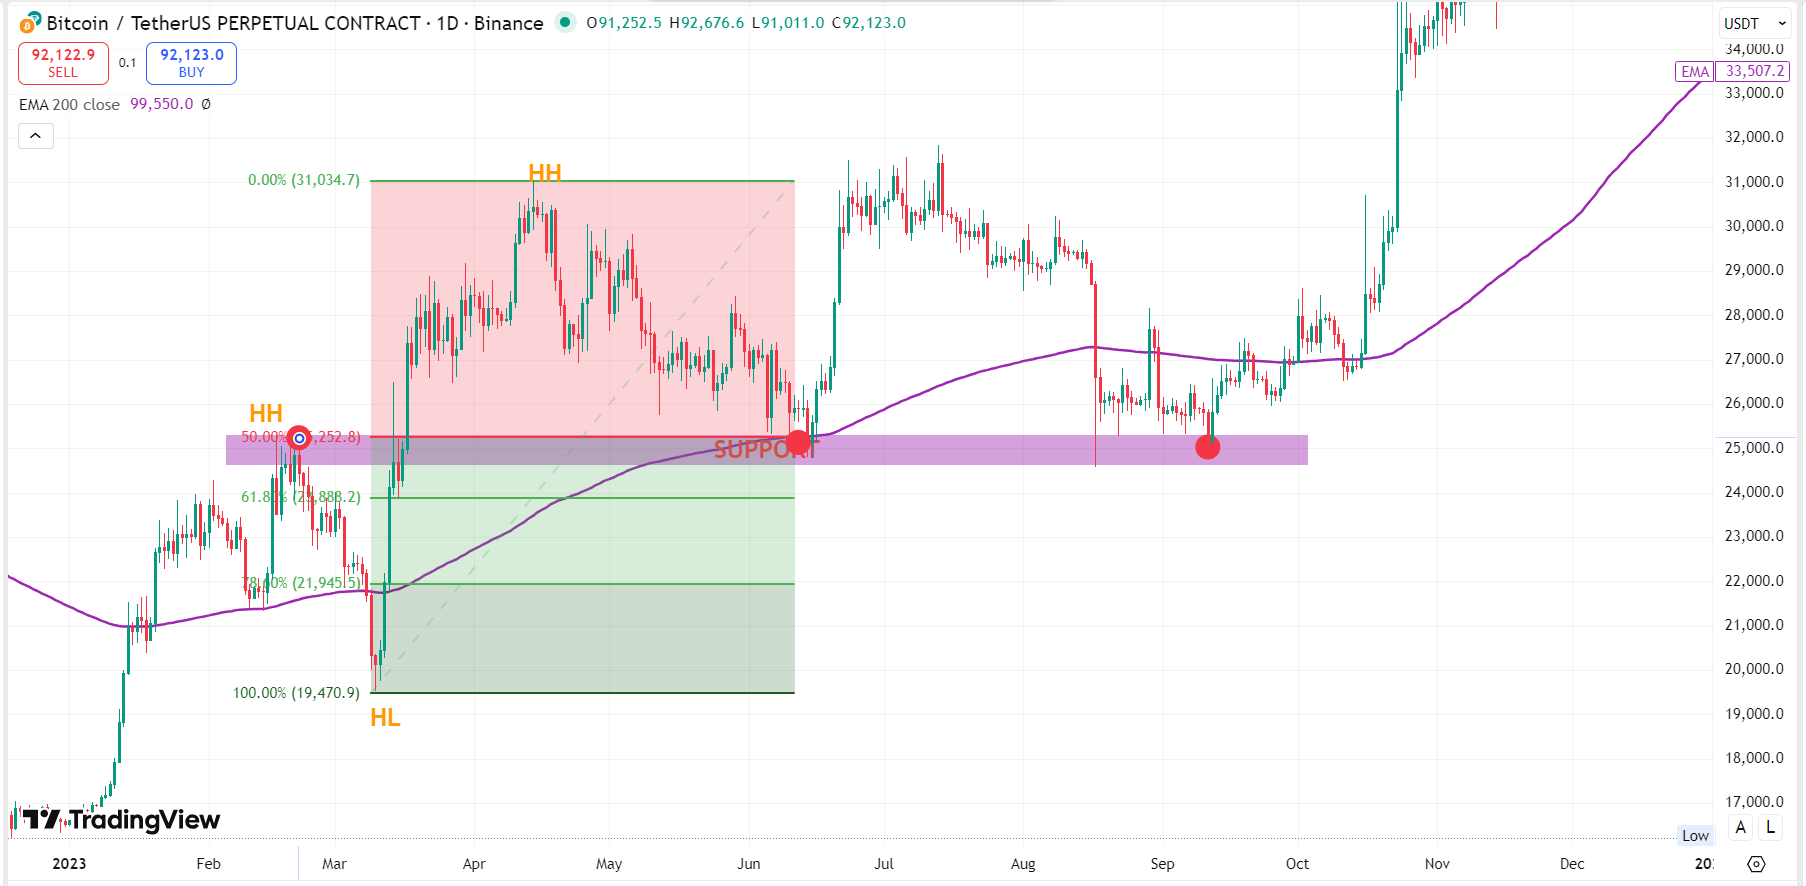
S/R + Moving Averages
- Setup: Price at key S/R level AND at moving average
- Example: Bitcoin at $30,000 support AND at 200 EMA
- Strength: Double confirmation, high probability
S/R + RSI
- Setup: Price at resistance + RSI overbought, or support + RSI oversold
- Example: ETH at $2,000 resistance + RSI >70
- Strength: Momentum confirmation at key level
S/R + Volume
- Setup: Price at S/R with volume spike
- Example: Support test with buying volume surge
- Strength: Institutional activity confirmation
VII. Common Support & Resistance Mistakes
| Mistake | Why It's Wrong | Solution |
|---|---|---|
| Too Many Levels | Chart becomes unreadable | Focus on 3-5 strongest levels on your timeframe |
| Trading Weak Levels | Single-touch levels often fail | Only trade levels with 2+ touches, confluence |
| No Confirmation | Entering at level without reversal signals | Wait for candlestick patterns, volume, indicator confirmation |
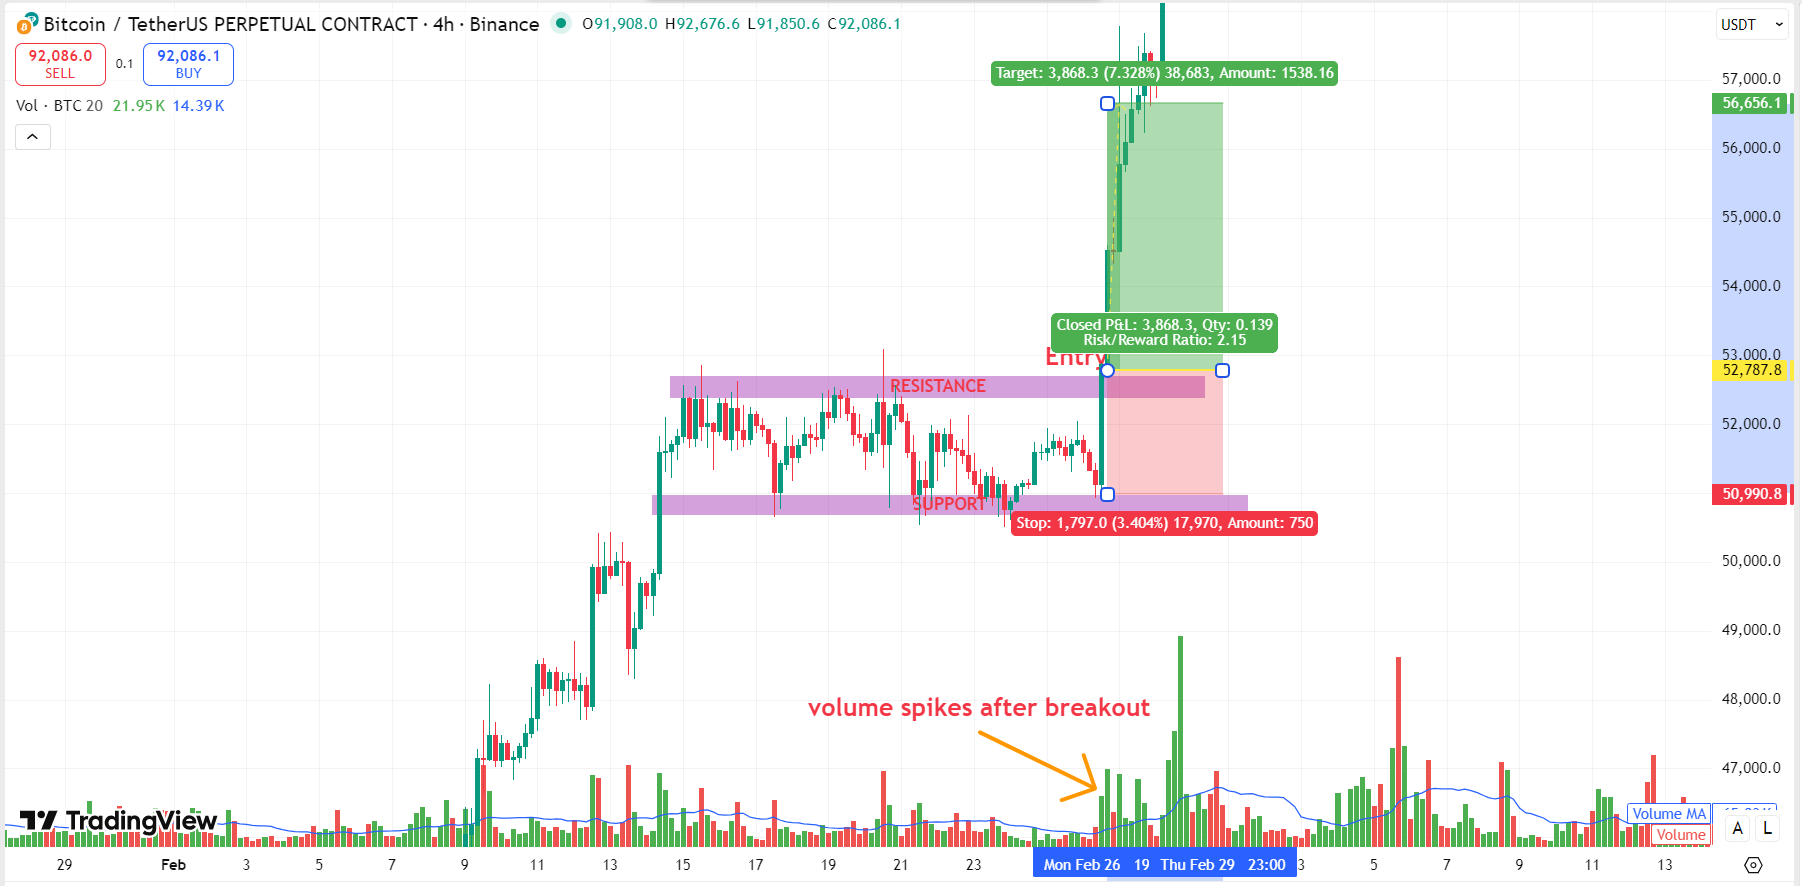
VIII. Practical S/R Trading Examples
Example 1: Support Bounce Trade
Example 2: Breakout Retest Trade
Conclusion
Key S/R Principles for Crypto Trading:
📊 Zones, Not Lines: S/R are areas where price reacts, not exact prices
🌍 Higher Timeframes Rule: Weekly S/R trumps daily, daily trumps 4H
🎯 Confluence Creates Confidence: Multiple S/R types at same level = high probability
🔄 Role Reversal is Real: Broken resistance becomes support, broken support becomes resistance
🎉 Congratulations! You've now completed Module 5!
Module 5: Workshop & Exam
Test your understanding of Candlesticks, Indicators, and Support/Resistance with this 15-question timed exam.
🛠️ Practical Workshop
TASK 1: Identify Candlestick Pattern
Find a chart showing a Hammer at support or Shooting Star at resistance. Note the location and volume.
TASK 2: RSI + MA Confluence
Find a setup where price is at a key moving average AND RSI is showing oversold/overbought with divergence.
TASK 3: Support/Resistance Trade Plan
Identify a key S/R level. Plan a bounce trade OR a breakout trade with entry, stop, target, and R:R.
📋 15-Question Exam
⏳ Time Left: 15:00
Student Notes (Real)
Real notes from students who completed this module. Use them to reinforce your learning.
✅ What I understood
"Candlestick patterns finally make sense! I now see the difference between a Hammer at support vs a Hanging Man at resistance. The body-to-wick ratio is key."
— Student note (placeholder)
⚠️ What I struggled with
"MACD histogram took me a while to understand, but now I see it leads price. Combining RSI divergences with Moving Averages gives me high-probability setups."
— Student note (placeholder)
🎯 My next step
"I'll practice identifying Support/Resistance zones on daily charts, then use RSI and MACD for entry timing. Journal every setup with screenshots."
— Student note (placeholder)
Want to submit your note?
Use a form page (example: support.html) to collect feedback. Avoid fake reviews. Publish only verified notes with consent.
Module 5 Complete
You now understand candlestick patterns, technical indicators (Moving Averages, RSI, MACD, Volume), and Support/Resistance. You're ready to combine these tools for professional-grade analysis.
Reminder: Education only. No guaranteed profits.