1.1 Introduction to Market Structure
Lesson Objective
Understand the foundational framework that reveals how price moves through time and provides context for all technical analysis.
Market structure is the foundational framework that reveals how price moves through time. It represents the "skeleton" of the market—the back bones that show the underlying form, while indicators and patterns are the "muscle and skin" that give it detail. Understanding market structure is essential for reading market sentiment, identifying trends, and anticipating future price movements.
I. What Is Market Structure?
Core Definition
Market structure refers to the arrangement of swing highs and lows that form trends and trading ranges. It's the study of how price organizes itself through time, creating identifiable patterns that reveal market psychology and potential future movement.
Key Insight:
Market structure shows WHERE price has been, WHERE it is now, and WHERE it's likely to go next based on historical price reactions.
Why It Matters
- Framework for Analysis: Provides context for all technical tools
- Early Warning System: Spots trend changes before indicators
- Risk Management: Identifies logical stop loss levels
- High Probability Zones: Pinpoints areas where price is likely to react
- Pure Price Action: Works without lagging indicators
II. Key Market Structure Concepts
Swing Points
- Definition: Price extremes (peaks and valleys)
- Types: Swing Highs & Swing Lows
- Significance: Building blocks of structure
Trend Structure
- Uptrend: HH + HL
- Downtrend: LH + LL
- Range: No clear HH/HL or LH/LL
Structural Levels
- Definition: Key price levels from swing points
- Types: Support & Resistance
- Significance: Areas of market reaction
III. Market Structure Hierarchy
| Timeframe | Structure Role | Trading Impact | Priority |
|---|---|---|---|
| Weekly | Primary structure | Major trend direction | 1st |
| Daily | Intermediate structure | Swing trading bias | 2nd |
| 4-Hour | Minor structure | Day trading direction | 3rd |
IV. Practical Application Framework
The 5-Step Market Structure Analysis
Identify Higher Timeframe Structure
Weekly → Daily → 4H. Determine primary trend direction.
Mark Key Swing Points
Identify significant highs and lows on your trading timeframe.
Draw Structural Levels
Connect swing points to create support/resistance zones.
Analyze Current Position
Where is price relative to structure?
Plan Trade Setup
Based on structure: bounce, breakout, or reversal?
Key Takeaways:
🏗️ Structure is Foundation: All technical analysis builds upon market structure
📍 Swing Points are Everything: Markets move from one swing point to another
🌍 Timeframe Hierarchy: Higher timeframe structure dominates lower timeframe moves
📈 Price Tells the Story: Structure reveals market psychology through pure price action
Next Lesson (1.2): We'll dive deep into Swing Highs & Swing Lows—the fundamental building blocks of market structure.
1.2 Swing Highs & Swing Lows
Key idea
Swing points are the turning points in price action—the peaks and valleys that form the market's structural framework.
Swing points are the turning points in price action—the peaks and valleys that form the market's structural framework. Correctly identifying these points is the first and most critical step in market structure analysis. Each swing point tells a story about the battle between buyers and sellers at that moment in time.
I. Precise Definitions
Swing High
A price peak surrounded by lower highs on both sides
Formal Definition:
A candlestick with a higher high than the candle before it AND a higher high than the candle after it. The highest point between two lower highs.
Swing Low
A price valley surrounded by higher lows on both sides
Formal Definition:
A candlestick with a lower low than the candle before it AND a lower low than the candle after it. The lowest point between two higher lows.
.png)
II. Swing Point Identification Rules
The 3-Step Identification Process
Step 1: Look Left
Check if the candlestick has a higher high (for swing high) or lower low (for swing low) than the candle BEFORE it
Step 2: Look Right
Check if the candlestick has a higher high (for swing high) or lower low (for swing low) than the candle AFTER it
Step 3: Confirm
Both conditions must be met. Wait for the confirming candle to close to avoid false signals
III. Determining Swing Point Significance
| Factor | High Significance | Medium Significance |
|---|---|---|
| Timeframe | Weekly/Daily | 4-Hour |
| Reaction Strength | Sharp reversal with volume | Moderate reversal |
| Confluence | Multiple TFs aligned | 2 TFs aligned |
IV. Trading Applications of Swing Points
Swing High Applications
Resistance Identification
Previous swing highs become resistance levels
Short Entry Signals
Price rejection at swing high = potential short
Stop Loss Placement
Place stops above recent swing highs
Swing Low Applications
Support Identification
Previous swing lows become support levels
Long Entry Signals
Price bounce at swing low = potential long
Stop Loss Placement
Place stops below recent swing lows
Key Swing Point Principles:
🔴 Swing Highs = Seller Control: Markets turn down when sellers overwhelm buyers
🔵 Swing Lows = Buyer Control: Markets turn up when buyers overwhelm sellers
📏 Wait for Confirmation: Never mark swings until confirming candle closes
🌍 Significance Varies: Higher timeframe swings > lower timeframe swings
Next Lesson (1.3): We'll explore HH, HL, LH, LL sequences—the language of trend analysis.
1.3 HH, HL, LH, LL Explained
Key idea
HH (Higher High), HL (Higher Low), LH (Lower High), and LL (Lower Low) are the four fundamental relationships between swing points that define market trends.
HH (Higher High), HL (Higher Low), LH (Lower High), and LL (Lower Low) are the four fundamental relationships between swing points that define market trends. These sequences form the language of trend analysis, allowing traders to objectively determine market direction, strength, and potential reversal points. Mastering these relationships is essential for understanding how markets trend, consolidate, and reverse.
I. The Four Basic Relationships
Bullish Relationships
Uptrend Components
Higher High (HH)
A swing high that exceeds the previous swing high. Shows buyers pushing price to new highs.
Market Psychology:
Buyers willing to pay higher prices, confidence increasing
Higher Low (HL)
A swing low that exceeds the previous swing low. Shows buyers defending higher levels.
Market Psychology:
Sellers unable to push price back to previous lows, bullish momentum
Bearish Relationships
Downtrend Components
Lower High (LH)
A swing high that fails to exceed the previous swing high. Shows sellers capping rallies.
Market Psychology:
Buyers unable to push price to previous highs, confidence decreasing
Lower Low (LL)
A swing low that fails to exceed the previous swing low. Shows sellers pushing to new lows.
Market Psychology:
Sellers aggressive, buyers unwilling to defend previous levels

II. How These Relationships Define Trends
Uptrend
- Formula: HH + HL
- Requirement: Both conditions must be met
- Psychology: Buyers in control
- Break: Failure to make HH or HL
- Trading: Buy pullbacks to HL
Downtrend
- Formula: LH + LL
- Requirement: Both conditions must be met
- Psychology: Sellers in control
- Break: Failure to make LH or LL
- Trading: Sell rallies to LH
Range/Congestion
- Pattern: No clear HH/HL or LH/LL
- Psychology: Buyers & sellers balanced
- Structure: Equal highs & lows
- Breakout: Eventually forms trend
- Trading: Buy support, sell resistance
III. Trend Strength Analysis Using HH/HL/LH/LL
| Pattern | Structure | Interpretation | Warning Sign |
|---|---|---|---|
| Strong Uptrend | Consistent HH + HL sequence | Healthy trend, likely to continue | HH with equal or lower HL |
| Strong Downtrend | Consistent LH + LL sequence | Healthy trend, likely to continue | LL with equal or higher LH |
| Weakening Uptrend | HH but equal or lower HL | Buyers losing control | Potential trend reversal |
| Weakening Downtrend | LL but equal or higher LH | Sellers losing control | Potential trend reversal |
IV. Practical Trading Applications
Uptrend Trading Strategy
Identify Uptrend
Confirm HH + HL sequence on daily/4H
Wait for Pullback
Price retraces to previous HL or support
Entry Confirmation
Bullish reversal pattern at support
Risk Management
Stop below HL, target next HH projection
Downtrend Trading Strategy
Identify Downtrend
Confirm LH + LL sequence on daily/4H
Wait for Rally
Price rallies to previous LH or resistance
Entry Confirmation
Bearish reversal pattern at resistance
Risk Management
Stop above LH, target next LL projection
V. Multi-Timeframe HH/HL/LH/LL Analysis
The 3-Timeframe Framework
Higher Timeframe
(Weekly/Daily)
- Role: Primary trend direction
- Analysis: Identify major HH/HL or LH/LL
- Trading: Determine overall bias
- Rule: Never trade against HTF trend
Trading Timeframe
(4-Hour/1-Hour)
- Role: Entry timing
- Analysis: Look for pullbacks in HTF trend
- Trading: Find precise entries
- Rule: Trade in HTF direction only
Entry Timeframe
(15-min/5-min)
- Role: Precise entry signals
- Analysis: Reversal patterns at key levels
- Trading: Execute with tight stops
- Rule: All TFs must align
Example Setup:
Weekly: HH + HL (Uptrend) → Daily: Pullback to HL → 4H: Bullish reversal pattern at HL → Entry: On 15-min confirmation with stop below HL
VI. Reversal Identification Using HH/HL/LH/LL
Bullish Reversal Pattern
Downtrend Structure
Market making LH + LL sequence
First Warning
Price makes LL but forms higher LH
Confirmation
Price breaks above most recent LH
New Structure
Market forms first HL (confirms reversal)
Bearish Reversal Pattern
Uptrend Structure
Market making HH + HL sequence
First Warning
Price makes HH but forms lower HL
Confirmation
Price breaks below most recent HL
New Structure
Market forms first LH (confirms reversal)
Key HH/HL/LH/LL Principles:
📈 Uptrend = HH + HL: Both conditions required
📉 Downtrend = LH + LL: Both conditions required
⚡ Weakness = Mixed Signals: HH with lower HL, or LL with higher LH
🌍 Higher Timeframes Dominate: Weekly structure > daily > 4H
🎯 Reversals Have Patterns: Structure breaks follow specific sequences
🧠 Practice Recognition: Start with clear trends, then analyze transitions
Next Lesson (1.4): We'll dive into Identifying Trend Direction—practical techniques for determining market bias across multiple timeframes.
1.4 Identifying Trend Direction
Key idea
Trading with the trend significantly increases your probability of success. Learn objective methods for determining trend direction across multiple timeframes.
Trend direction is the single most important piece of information for any trader. Trading with the trend significantly increases your probability of success, while trading against it is one of the most common reasons for failure. This lesson will teach you practical, objective methods for determining trend direction across multiple timeframes and market conditions.
I. The Three Trend Types
Uptrend
Bullish Market
- Definition: Series of HH + HL
- Psychology: Buyers in control
- Price Action: Higher highs & higher lows
- Trading: Buy dips, sell rallies cautiously
Downtrend
Bearish Market
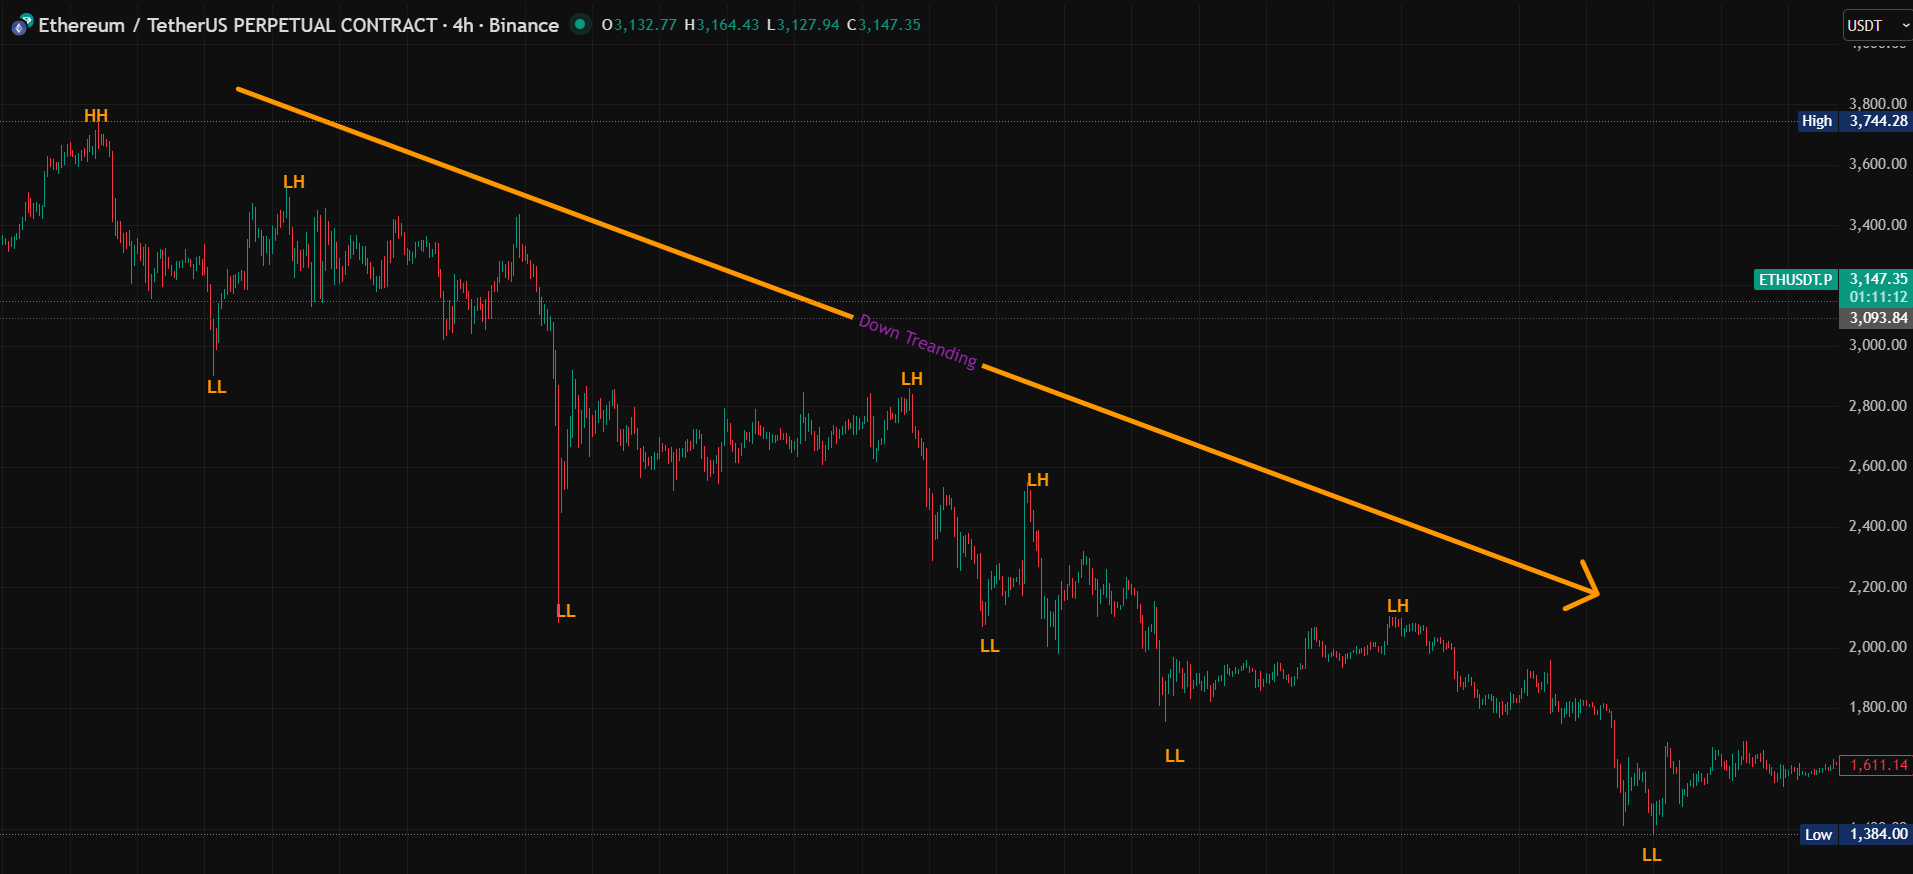
- Definition: Series of LH + LL
- Psychology: Sellers in control
- Price Action: Lower highs & lower lows
- Trading: Sell rallies, buy dips cautiously
Range/Congestion
Sideways Market
- Definition: No clear HH/HL or LH/LL
- Psychology: Buyers & sellers balanced
- Price Action: Equal highs & lows
- Trading: Buy support, sell resistance

II. Four Trend Identification Methods
Method 1: Swing Point Analysis
Uptrend Identification
Look for at least 2 consecutive HH and 2 consecutive HL. The more sequences, the stronger the trend.
Downtrend Identification
Look for at least 2 consecutive LH and 2 consecutive LL. The more sequences, the stronger the trend.
Range Identification
Look for equal highs and equal lows with no clear HH/HL or LH/LL sequences.
Method 2: Moving Average Analysis
Uptrend Signals
Price above 50 EMA, 50 EMA above 200 EMA, EMA ribbon fanning upward
Downtrend Signals
Price below 50 EMA, 50 EMA below 200 EMA, EMA ribbon fanning downward
Range Signals
Price oscillating around MAs, MAs flat and tangled, no clear alignment
III. Multi-Timeframe Trend Analysis Framework
The 3-Timeframe Trend Alignment System
Trend Timeframe
(Weekly)
- Purpose: Determine primary trend
- Analysis: 20+ week structure
- Question: What's the BIG picture?
- Decision: Long-term bias
Trading Timeframe
(Daily)
- Purpose: Determine intermediate trend
- Analysis: 20+ day structure
- Question: What's the current trend?
- Decision: Swing trading bias
Entry Timeframe
(4-Hour)
- Purpose: Determine short-term trend
- Analysis: 20+ 4H structure
- Question: What's the immediate trend?
- Decision: Entry timing
Golden Rule of Multi-Timeframe Analysis:
Only trade in the direction of the higher timeframe trend. If weekly is uptrend, only look for long setups on daily and 4H. If timeframes conflict, stay out until alignment occurs.
IV. Trend Strength Assessment
| Strength Level | Swing Point Structure | Moving Average Alignment | Trading Implication |
|---|---|---|---|
| Very Strong | Clean HH/HL or LH/LL, steep angle | Price far from MAs, MAs widely spaced | High conviction trades, larger positions |
| Strong | Clear HH/HL or LH/LL, moderate angle | Price above/below MAs, MAs aligned | Normal trading, standard risk |
| Moderate | Mixed signals, shallow angle | Price near MAs, MAs close together | Reduced position size, tighter stops |
V. Practical Trading with the Trend
Uptrend Trading Rules
Bias
Only look for long setups
Entries
Buy pullbacks to support/previous HL
Stops
Below recent swing low/HL
Targets
Previous HH or measured moves
Exit Signal
Failure to make new HH or break below HL
Downtrend Trading Rules
Bias
Only look for short setups
Entries
Sell rallies to resistance/previous LH
Stops
Above recent swing high/LH
Targets
Previous LL or measured moves
Exit Signal
Failure to make new LL or break above LH
VI. Trend Transition Identification
Early Warning Signs of Trend Change
First Warning
- Uptrend: HH with equal or lower HL
- Downtrend: LL with equal or higher LH
- Action: Reduce position size
Second Warning
- Uptrend: Failure to make HH
- Downtrend: Failure to make LL
- Action: Close partial positions
Confirmation
- Uptrend: Break below key HL
- Downtrend: Break above key LH
- Action: Exit remaining positions
Key Trend Identification Principles:
🚀 Trend is Your Friend: Trading with trend increases probability significantly
🌍 Higher Timeframes Rule: Weekly trend > Daily > 4H
📈 Structure Defines Trend: HH+HL = Uptrend, LH+LL = Downtrend
⚡ Strength Matters: Adjust position size based on trend strength
Next Lesson (1.5): We'll explore Structure Breaks & Trend Reversal Basics—how to identify when trends are ending.
1.5 Structure Breaks & Trend Reversal Basics
Key idea
Structure breaks occur when price violates key swing points, signaling potential trend changes. Learn to distinguish between meaningful reversals and false breaks.
Structure breaks occur when price violates key swing points, signaling potential trend changes. However, not every break leads to a reversal—some are merely pullbacks within the larger trend. This lesson will teach you how to distinguish between meaningful structure breaks that lead to reversals and false breaks that offer continuation opportunities.
I. What Are Structure Breaks?
Basic Definition
A structure break occurs when price moves beyond a significant swing point (swing high or swing low) that previously acted as support or resistance. These breaks challenge the existing market structure and often signal shifts in market psychology and control.
Critical Insight:
Structure breaks are WARNING SIGNS, not automatic reversal signals. They indicate that the current trend is being challenged, but confirmation is required.
Why Structure Breaks Matter
- Early Warning System: Spot potential reversals before indicators
- Market Psychology: Reveals shifts in buyer/seller control
- Risk Management: Identifies invalidation points for trades
- High Probability Zones: Break + retest setups offer excellent risk/reward
II. Types of Structure Breaks
Bullish Structure Breaks
Break Above Swing High
Price moves above a previous swing high, breaking resistance. In uptrend: Continuation signal. In downtrend: Potential reversal signal.
Break Above Downtrend Structure
Price breaks above a series of LH (Lower Highs), suggesting downtrend may be ending.
Bearish Structure Breaks
Break Below Swing Low
Price moves below a previous swing low, breaking support. In downtrend: Continuation signal. In uptrend: Potential reversal signal.
Break Below Uptrend Structure
Price breaks below a series of HL (Higher Lows), suggesting uptrend may be ending.
III. Break vs Reversal: Key Distinctions
| Factor | True Reversal Break | False/Pullback Break |
|---|---|---|
| Volume | High volume on break | Low volume on break |
| Momentum | Strong follow-through after break | Weak move, quickly reverses |
| Timeframe Context | Break aligns with higher TF reversal | Contradicts higher TF structure |
| Retest Behavior | Broken level holds as new S/R | Price re-enters previous range |
IV. Reversal Confirmation Signals
Bullish Reversal Confirmation
Structure Break
Price breaks above key LH or resistance
Retest Success
Price retests broken level as support and holds
Higher Low Formation
Price creates first HL above previous LL
Bearish Reversal Confirmation
Structure Break
Price breaks below key HL or support
Retest Success
Price retests broken level as resistance and rejects
Lower High Formation
Price creates first LH below previous HH
V. Trading Structure Breaks Safely
The 3-Phase Break Trading Framework
Phase 1: Anticipation
- Action: Watch for warning signs
- Setup: Trend weakening, momentum divergence
- Position: No trade, just observation
Phase 2: Break & Retest
- Action: Wait for retest after break
- Setup: Price returns to broken level
- Position: Small position on retest confirmation
Phase 3: Confirmation
- Action: Add to position on confirmation
- Setup: New structure forms (HL/LH)
- Position: Full position with confirmed trend
Critical Risk Management Rule:
Never trade the initial break. Most false breaks occur immediately after the initial move. Always wait for a retest and confirmation before entering.
VI. Common Structure Break Patterns
Bullish Patterns
Downtrend Line Break
Price breaks above descending trendline connecting LHs. First sign of downtrend weakening.
Double Bottom Breakout
Price breaks above neckline after forming two equal lows. Strong reversal pattern.
Bearish Patterns
Uptrend Line Break
Price breaks below ascending trendline connecting HLs. First sign of uptrend weakening.
Double Top Breakdown
Price breaks below neckline after forming two equal highs. Strong reversal pattern.
Key Structure Break Principles:
⚡ Breaks are Warnings: Not every break leads to reversal
🔄 Retest is Critical: Always wait for retest before trading
🚫 Don't Chase Initial Break: Most false signals occur here
🎯 Trade Retest + Confirmation: Highest probability setup
Next Lesson (1.6): We'll explore Combining Structure With Pattern—how to integrate market structure with candlestick patterns for high-probability setups.
1.6 Combining Structure With Pattern
Key idea
When structure and pattern align at key levels, they create high-probability trading opportunities with excellent risk/reward ratios.
Market structure provides the framework, while patterns provide the timing. When structure and pattern align at key levels, they create high-probability trading opportunities with excellent risk/reward ratios. This lesson will teach you how to integrate structure analysis with candlestick patterns, chart patterns, and volume for precise entry timing.
I. The Structure-Pattern-Volume Triangle
Structure
- Role: Framework & Context
- Answers: WHERE to trade
- Provides: Support/Resistance levels
- Priority: Highest (1st)
Pattern
- Role: Timing & Entry Signal
- Answers: WHEN to trade
- Provides: Entry triggers
- Priority: Medium (2nd)
Volume
- Role: Confirmation & Conviction
- Answers: HOW STRONG is the move
- Provides: Confirmation of interest
- Priority: Confirming (3rd)
II. Structure + Candlestick Patterns
Bullish Combinations at Support
Hammer/Inverted Hammer at HL
Bullish reversal pattern forms at previous higher low (HL) in uptrend. High probability bounce setup.
Bullish Engulfing at Structure Support
Large bullish candle engulfs previous bearish candle at key support level.
Bearish Combinations at Resistance
Shooting Star at LH
Bearish reversal pattern forms at previous lower high (LH) in downtrend. High probability rejection setup.
Bearish Engulfing at Structure Resistance
Large bearish candle engulfs previous bullish candle at key resistance level.
III. The Complete Trading Process
5-Step Structure+Pattern Trading Framework
Identify Higher Timeframe Structure
Weekly/Daily - Determine primary trend direction and key levels.
Mark Key Structural Levels
Identify swing points, support/resistance on trading timeframe.
Wait for Price to Approach Structure
Monitor as price nears key levels - anticipate potential reactions.
Look for Pattern Formation
Watch for candlestick patterns forming at structural levels.
Confirm with Volume & Enter
Volume confirms pattern, enter with stop beyond structure level.
IV. Risk Management in Structure+Pattern Trading
| Trade Type | Stop Loss Placement | Take Profit Target | R:R Ratio |
|---|---|---|---|
| Bounce at Support | Below structure level | Previous swing high | 1:2 minimum |
| Rejection at Resistance | Above structure level | Previous swing low | 1:2 minimum |
| Breakout Trade | Below breakout level | 1:1 measured move | 1:1.5 minimum |
V. Practical Examples
Example 1: Uptrend Pullback Setup
Structure Context
Daily chart shows HH + HL uptrend. Price pulling back to previous HL at $30K.
Pattern Formation
4H chart shows bullish engulfing pattern forming exactly at $30K support.
Trade Execution
Enter long on close of engulfing candle. Stop below $30K. Target previous HH at $32K.
Example 2: Downtrend Rally Setup
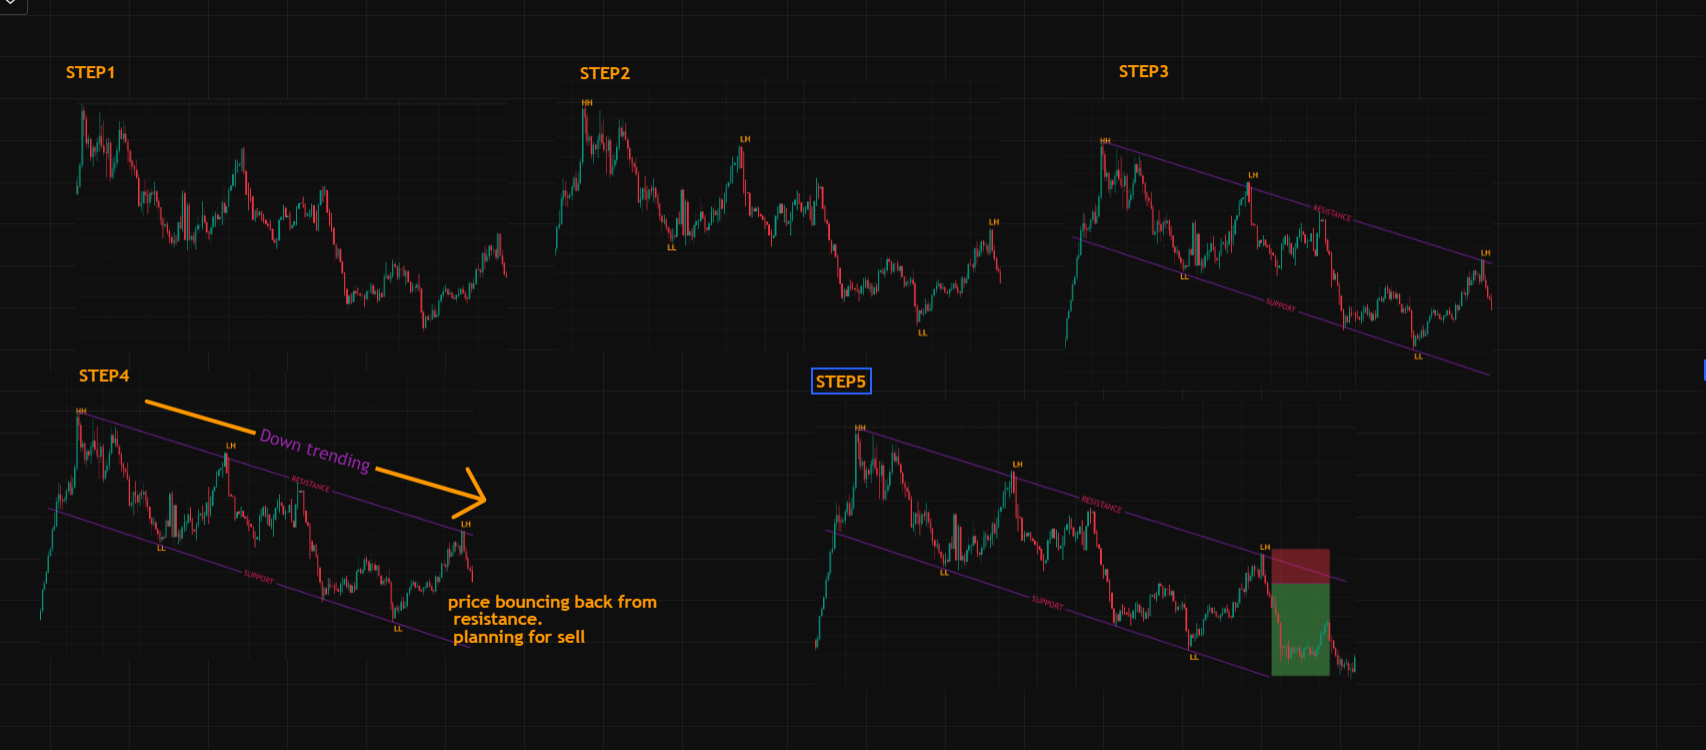
Structure Context
Daily chart shows LH + LL downtrend. Price rallying to previous LH at $28K.
Pattern Formation
4H chart shows evening star pattern forming exactly at $28K resistance.
Trade Execution
Enter short on close of evening star. Stop above $28K. Target previous LL at $26K.
Key Structure+Pattern Principles:
🏗️ Structure First: Always identify structure before looking for patterns
🕯️ Patterns Second: Use patterns for timing entries at structure levels
📊 Volume Third: Volume confirms pattern validity at structure
🎯 Alignment is Key: HTF structure + LTF pattern + volume = high probability
Next: Module 1 Quiz & Assessment - Test your understanding of market structure concepts.
Module 1: Workshop & Exam
Test your understanding of Market Structure concepts before moving to Module 2.
🛠️ Practical Workshop
TASK 1: Identify Swing Points
On a daily BTC chart, identify 3 significant swing highs and 3 swing lows. Note the timeframe and reaction strength.
TASK 2: Trend Structure Analysis
Analyze current market structure on ETH daily chart. Is it uptrend (HH+HL), downtrend (LH+LL), or ranging? Provide evidence.
TASK 3: Structure Break Plan
Find a recent structure break on any pair. Plan a trade using the break + retest strategy with entry, stop, target, and R:R.
📋 10-Question Exam
Student Notes (Real)
Real notes from students who completed this module. Use them to reinforce your learning.
✅ What I understood
"Market structure is the foundation everything else builds on. I used to jump straight to indicators, but now I see structure first. Swing points are everything!"
— Student note (placeholder)
⚠️ What I struggled with
"Distinguishing between pullbacks and reversals took practice. The break + retest concept was key—now I wait for confirmation instead of chasing."
— Student note (placeholder)
🎯 My next step
"I'll practice multi-timeframe structure analysis daily. Mark swing points on weekly, daily, and 4H charts for BTC/ETH. Journal every observation."
— Student note (placeholder)
Want to submit your note?
Use a form page (example: support.html) to collect feedback. Avoid fake reviews. Publish only verified notes with consent.
Module 1 Complete
You now understand market structure: swing points, trend sequences, structure breaks, and pattern integration. You're ready to analyze charts like a professional price action trader.
Reminder: Education only. No guaranteed profits.