4.1 What is Technical Analysis?
Lesson Objective
Understand the core philosophy of Technical Analysis, its relevance in crypto markets, and the difference between subjective vs objective approaches.
Technical Analysis (TA) is the study of past market data, primarily price and volume, to forecast future price direction and identify trading opportunities. In the volatile, 24/7 crypto markets, TA is the language of short-to-medium-term traders and a critical skill for any participant looking to time entries, manage risk, and understand market psychology.
Core Philosophy
- The Market Discounts Everything: All known information—news, fundamentals, rumors, and market sentiment—is already reflected in the current price. The chart tells the whole story.
- Price Moves in Trends: Prices are not random; they exhibit directional movements (trends) that persist over time. The primary goal of TA is to identify a trend in its early stage and trade in its direction.
- History Tends to Repeat Itself: Market psychology is cyclical. Patterns of greed and fear repeat, creating recognizable chart patterns and price behaviors that can signal future movements.
I. The TA Toolkit: What You're Actually Analyzing
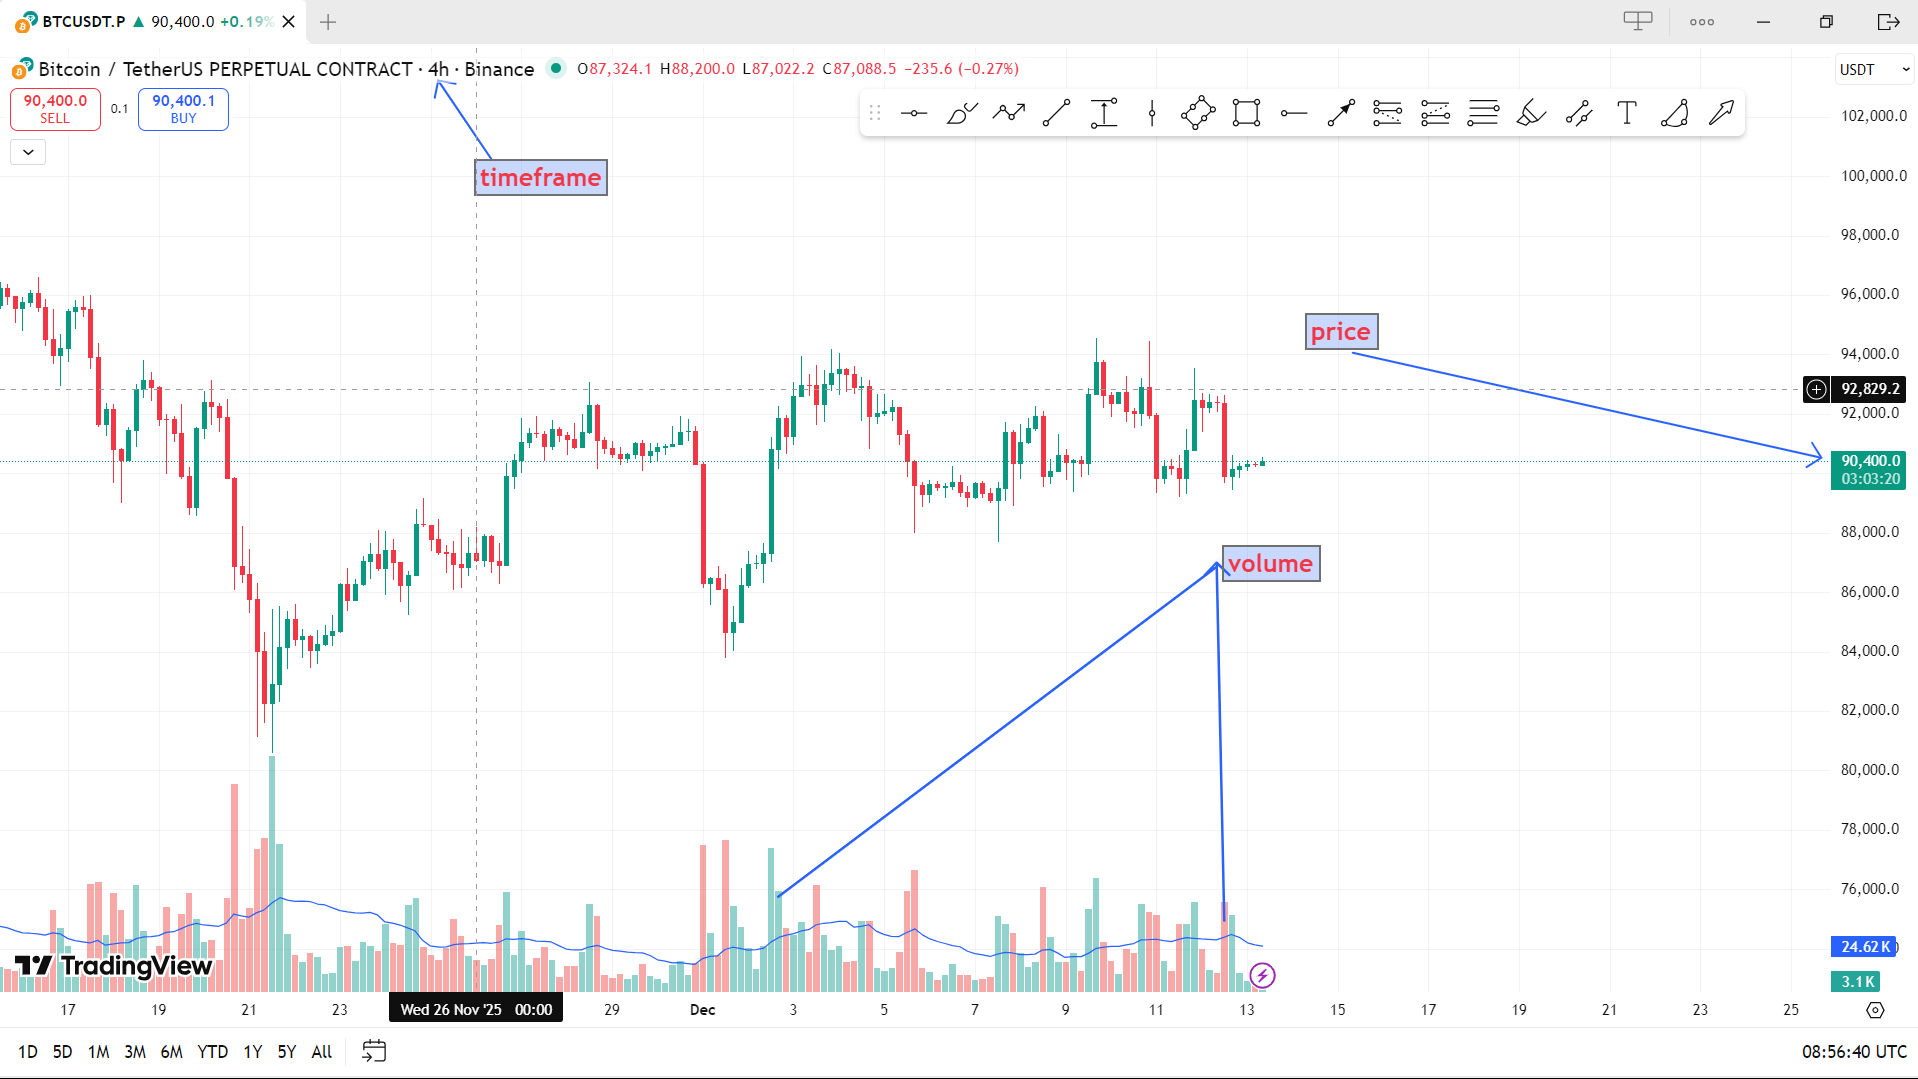
- Price: The most important data point. It represents the consensus value of all market participants at any given moment.
- Volume: The number of units (coins, contracts) traded in a period. It's the fuel behind the price move, used to confirm the strength or weakness of a trend.
- Time: The context in which price and volume changes occur. Trends and patterns are analyzed within specific timeframes (e.g., 1-hour, daily, weekly).
Analogy
Think of TA like being a detective examining footprints (price) in the snow. The depth of the footprint tells you the person's weight (volume/strength). The direction and spacing of the footprints tell you where they're going and how fast (trend). Your job is to deduce where they're heading next.
II. Why is TA Especially Relevant for Crypto?
- 24/7 Market: With no closing bell, price action is continuous, providing a pure, unbroken data stream perfect for technical study.
- High Volatility & Leverage: Crypto's wild swings and pervasive leverage (up to 100x on some platforms) make precise entry/exit and risk management non-negotiable. TA provides the framework for this.
- Efficiency in Speculative Markets: For many altcoins with thin fundamentals, price is driven almost entirely by sentiment and momentum—forces that TA is designed to measure.
- Global, Retail-Driven Participation: Crypto markets are heavily influenced by retail trader psychology, which tends to create and follow clear technical patterns and levels.
III. The Two Main Schools of Thought in TA
A. Subjective (Discretionary) TA
- Focus: Interpreting chart patterns and market structure.
- Practitioner's Mindset: "The chart is a story. I am reading the auction between buyers and sellers."
- Tools: Support/Resistance, Trendlines, Chart Patterns (Head & Shoulders, Triangles), Candlestick Patterns, Volume Profile.
- Strength: Flexible, accounts for market context and narrative.
- Weakness: Prone to personal bias; two analysts may see different patterns.
B. Objective (Systematic) TA
- Focus: Applying mathematical indicators and oscillators to price data.
- Practitioner's Mindset: "I am following a set of mathematical rules generated by my system."
- Tools: Moving Averages, RSI, MACD, Bollinger Bands, Stochastic.
- Strength: Rule-based, removes emotion, easily backtested.
- Weakness: Lagging (based on past data); can give false signals in ranging markets.
The best traders blend both approaches.
IV. Common Misconceptions & Crucial Realities
-
❌
"TA is a crystal ball that predicts the future with
certainty."
✅ Reality: TA deals in probabilities, not certainties. It identifies high-probability scenarios based on historical tendencies. A 70% win rate is considered exceptional. -
❌
"If it were that easy, everyone would be rich."
✅ Reality: TA is simple to learn but incredibly difficult to master. The challenge isn't the patterns; it's the psychology of executing trades with discipline, managing losses, and avoiding emotional decisions. -
❌
"TA doesn't work in crypto because of manipulation."
✅ Reality: While manipulation (whale walls, spoofing) exists, it often occurs at key technical levels that many participants are watching. This can make these levels more significant, not less. -
❌
"You can just follow a YouTube indicator and get
rich."
✅ Reality: There is no holy grail indicator. Over-reliance on a single tool is a recipe for failure. TA is a holistic practice.
V. The First Mental Shift: From Investor to Trader
- An Investor asks: "Is this asset fundamentally undervalued for the long term?"
- A Trader asks: "What is the current market structure, and what is the highest probability price path from here? Where is my risk if I'm wrong?"
TA is the language of the trader. It is agnostic to an asset's "true value." It cares only about the auction process happening right now on the chart.
VI. A Simple TA Framework in Action
- Determine the Trend: Is the price making Higher Highs and Higher Lows (Uptrend) or Lower Highs and Lower Lows (Downtrend)? Always trade in the direction of the higher timeframe trend for better odds.
- Identify Key Levels: Where are the obvious areas of Support (floor) and Resistance (ceiling)?
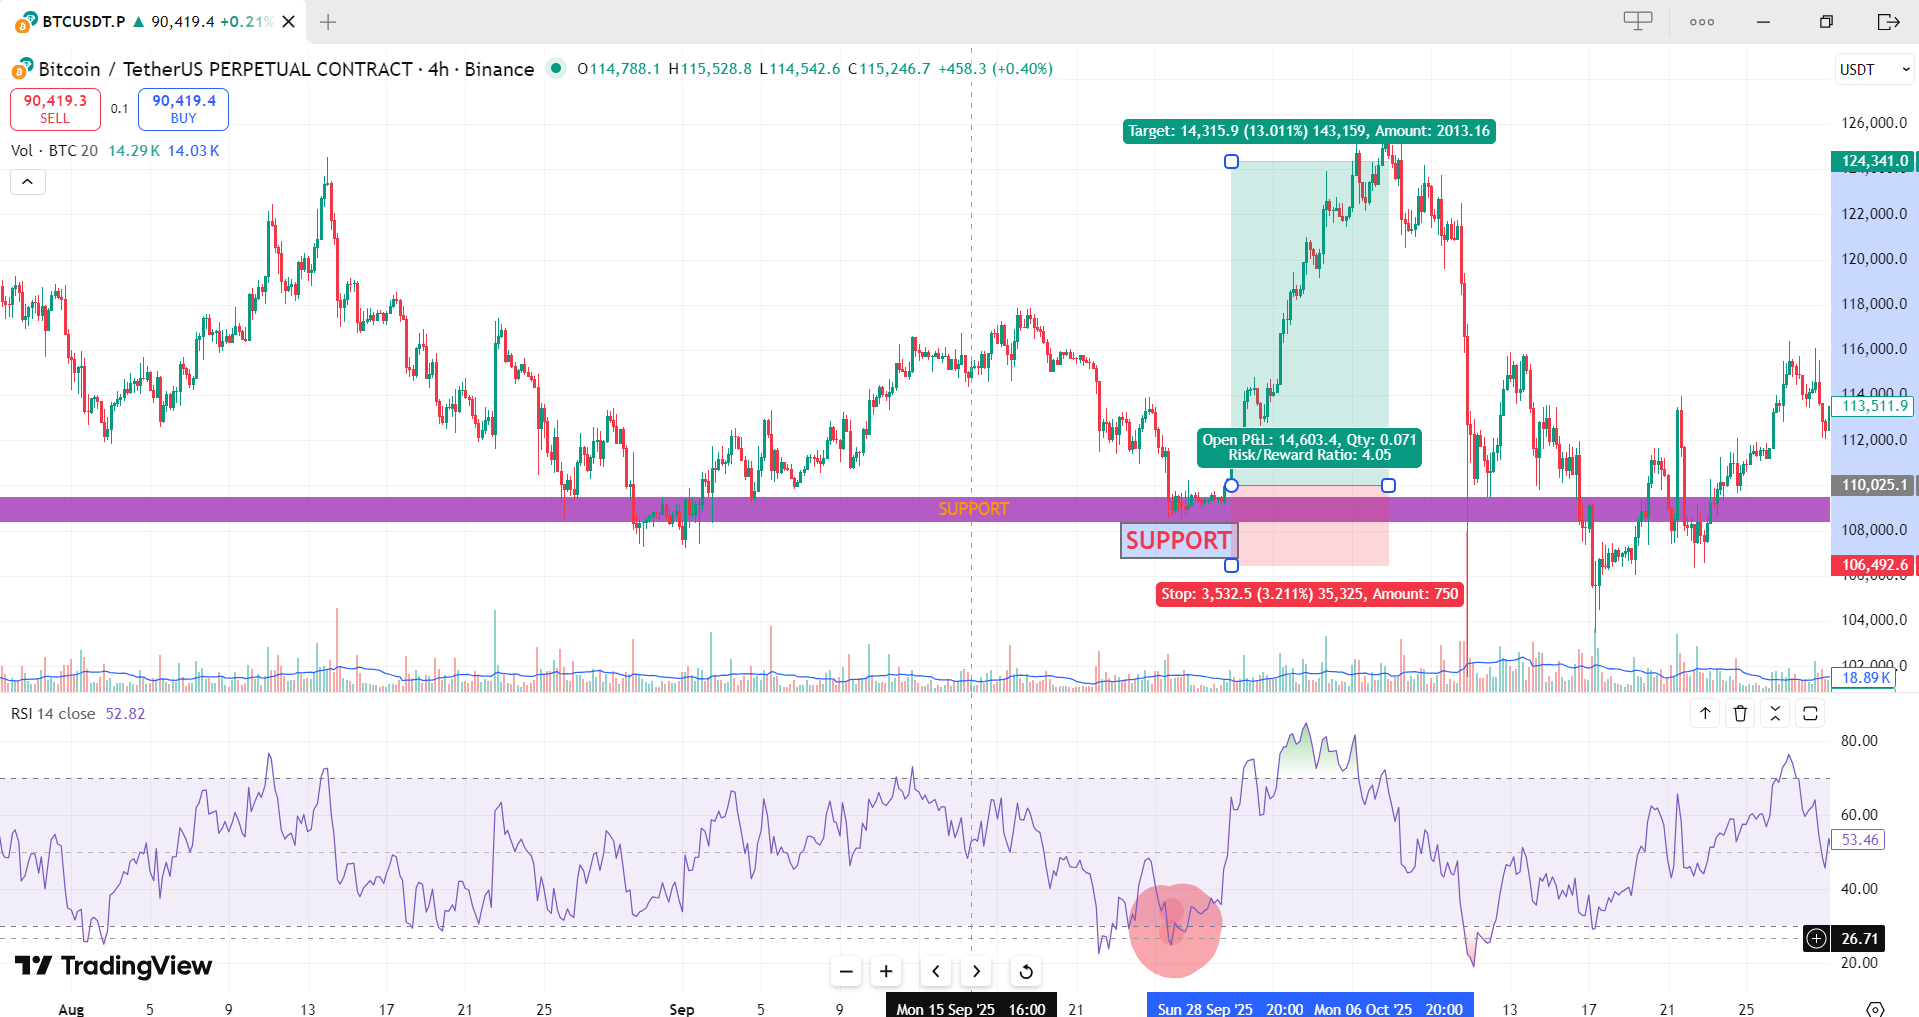
- Look for Confluence: Do multiple TA tools agree? (e.g., price is at a support level and the RSI is oversold and a bullish candlestick pattern forms).
- Define Your Risk: Before entering, know exactly where you will exit if the trade fails (Stop-Loss). Your potential profit (Take-Profit) should be meaningfully larger than your potential loss (positive Risk/Reward Ratio, e.g., 2:1).
Example: In an uptrend, you wait for a pullback to a rising support trendline that also aligns with a key horizontal support level. The RSI dips near 40 (not oversold, showing strength). You buy there, with a stop-loss just below the support confluence.
Conclusion: The Map, Not the Territory
- Objectively define market conditions (trending vs. ranging).
- Plan your trades with clear entry, exit, and risk parameters.
- Remove emotion by following predefined rules.
- Understand market psychology by interpreting what price action reveals about the battle between buyers and sellers.
✅ Final Key Takeaway
Technical Analysis is a probability-based system for reading market behavior, managing risk, and executing disciplined trades in the fast moving crypto markets.
4.2 Market Trends (Bullish, Bearish, Ranging)
Key idea
The trend is your friend. Identifying the prevailing market trend is the first and most critical step in any analysis.
In Technical Analysis, the trend is your friend. Identifying the prevailing market trend is the first and most critical step in any analysis, as it establishes the highest-probability direction for future price movement. Ignoring the trend is the fastest way to lose capital. Trends are typically categorized into three primary states: Bullish (Uptrend), Bearish (Downtrend), and Ranging (Sideways/Consolidation).
I. The Anatomy of a Trend
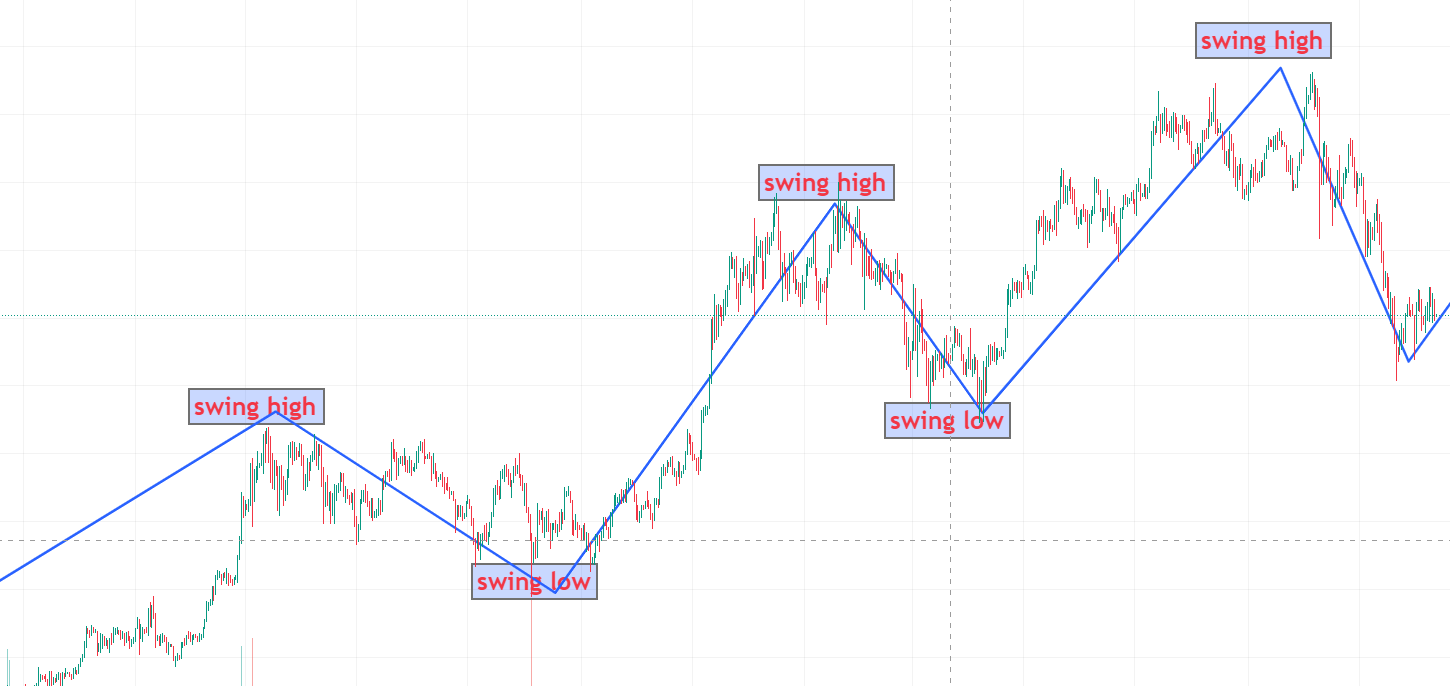
A trend is defined by the relationship between swing highs (peaks) and swing lows (troughs) on a price chart.
Key Components:
- Swing High (SH): A price peak where the candles to its left and right have lower highs.
- Swing Low (SL): A price trough where the candles to its left and right have higher lows.
- Market Structure (MS): The sequential arrangement of these swing points defines the trend.
II. The Three Primary Market Trends
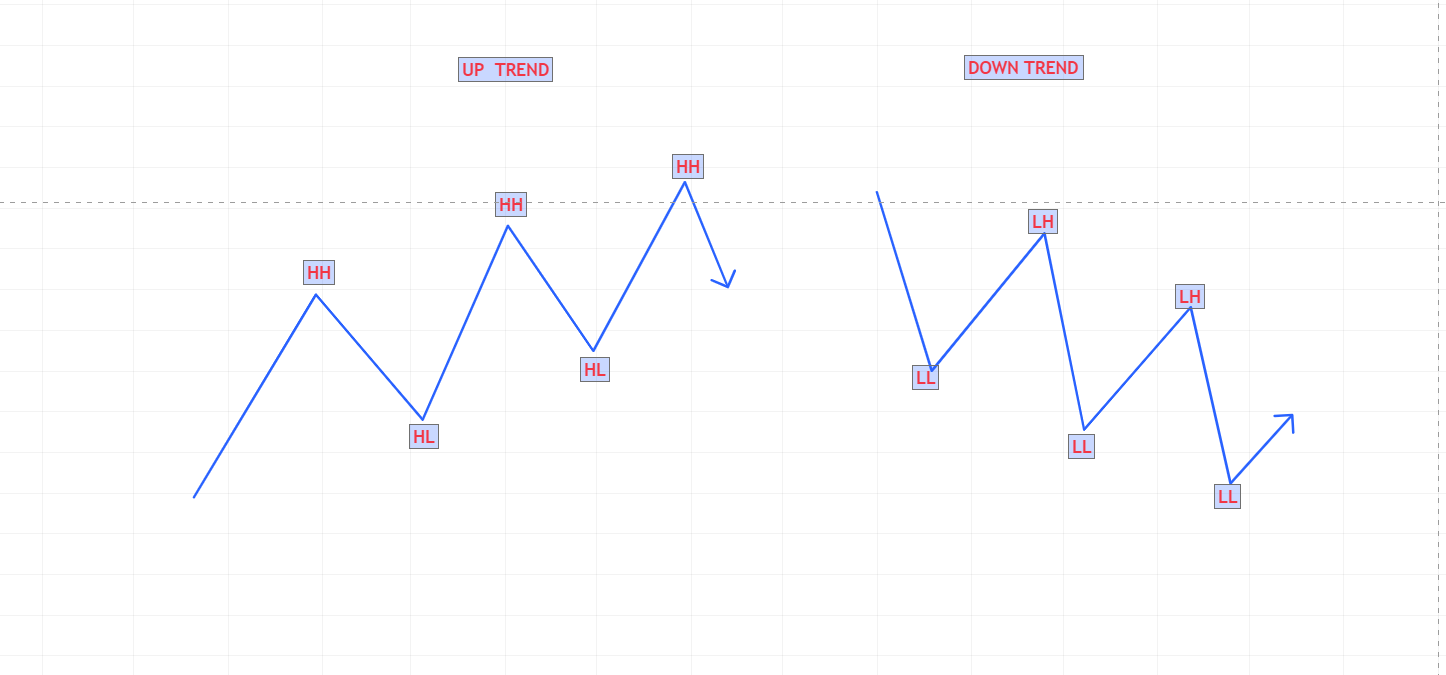
1. Bullish Trend (Uptrend)
Definition: A sustained period where the price is making Higher Highs (HH) and Higher Lows (HL).
Market Structure: HH > HL > HH > HL
Psychology: Optimism and greed dominate. Buyers are in control, aggressively bidding up the price. Sellers are weak or absent at key levels.
Trader's Mindset: "Buy the dip." Look for opportunities to enter on pullbacks toward support (the rising HLs). Avoid shorting (betting against) a strong uptrend.
- Price consistently respects a rising support trendline connecting the HLs.
- Moving Averages (e.g., 50 > 200) are sloping upwards, with price often above them.
- Example (Bitcoin 2020–2021 Bull Run): Each major correction found a bottom at a level higher than the previous correction's low, and each rally peak exceeded the prior peak.
.png)
2. Bearish Trend (Downtrend)
Definition: A sustained period where the price is making Lower Highs (LH) and Lower Lows (LL).
Market Structure: LH > LL > LH > LL
Psychology: Pessimism and fear dominate. Sellers are in control, aggressively offloading assets. Buyers are only present for brief, weak rallies.
Trader's Mindset: "Sell the rally." Look for opportunities to enter short positions on bounces toward resistance (the descending LHs). Avoid buying (going long) in a strong downtrend.
- Price consistently respects a falling resistance trendline connecting the LHs.
- Moving Averages are sloping downwards, with price often below them.
- Example (Crypto Bear Market 2022): Every attempt to rally failed at a level lower than the previous rally's high, and each subsequent crash broke below the prior crash's low.
.png)
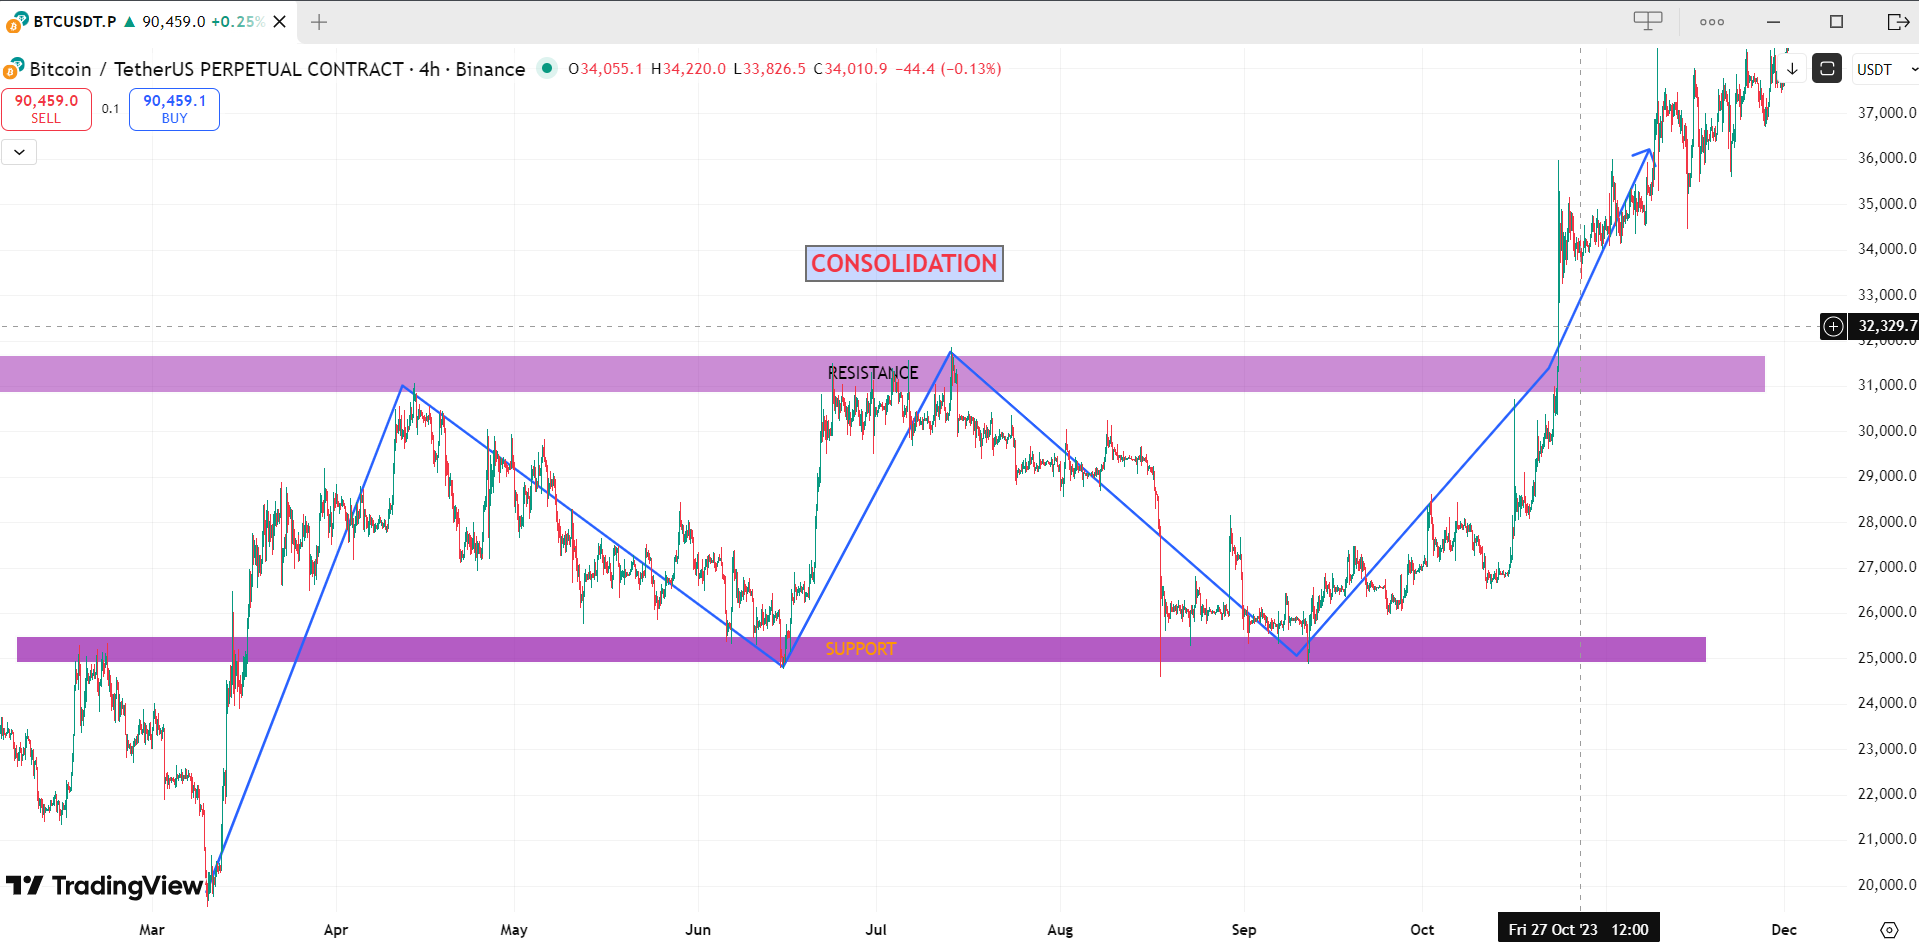
3. Ranging Market (Sideways/Consolidation)
Definition: A period where price oscillates between a well-defined horizontal support and resistance level, with no clear directional bias.
Market Structure: Equal Highs and Equal Lows. Price rejects from both levels repeatedly.
Psychology: Indecision and equilibrium. Buyers and sellers are in balance. The market is "accumulating" or "distributing" before its next major directional move.
Trader's Mindset: "Fade the edges." Buy near support, sell near resistance (Range Trading). The worst action is to buy a breakout prematurely or sell a breakdown in the middle of the range.
- Price moves within a horizontal channel or rectangle pattern.
- Moving Averages flatten out and price chops around them.
- Example (Bitcoin Consolidation): Price bounces between $29k support and $31k resistance for weeks, building energy for its next major move.
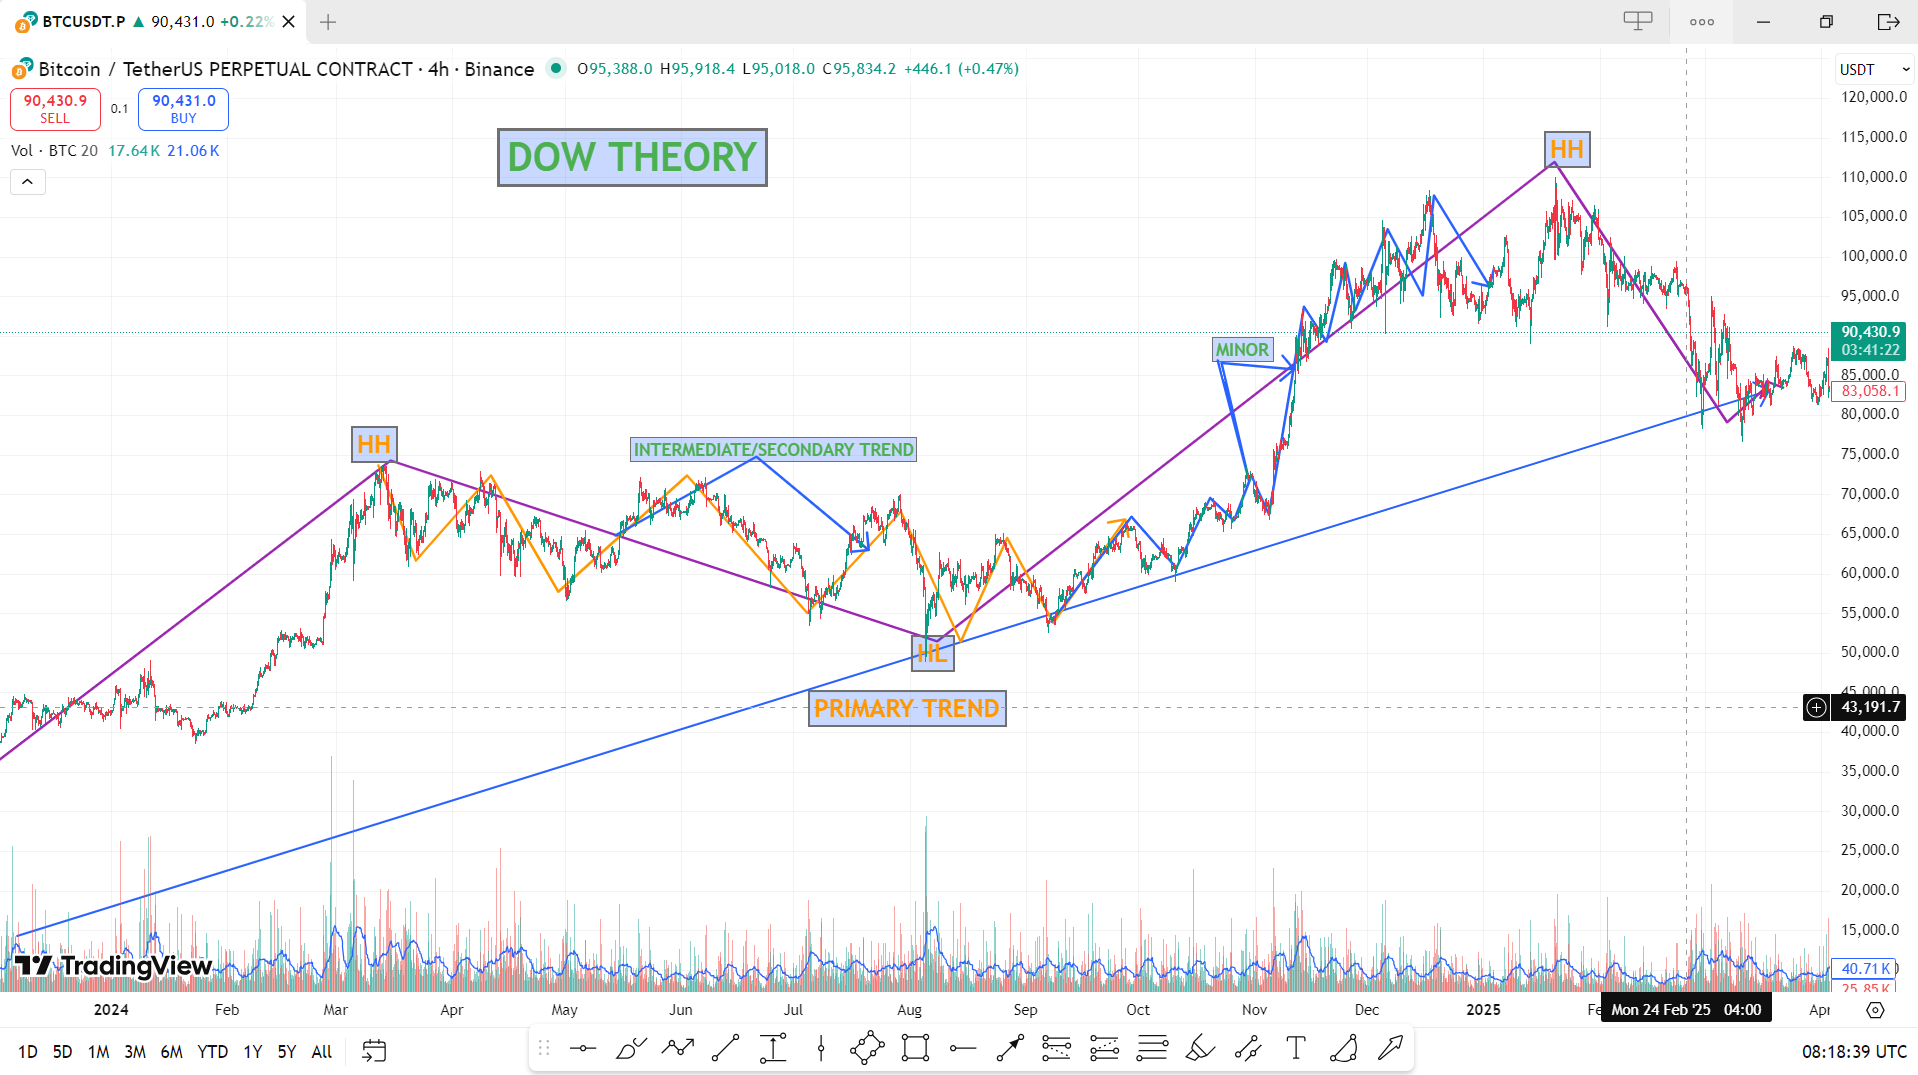
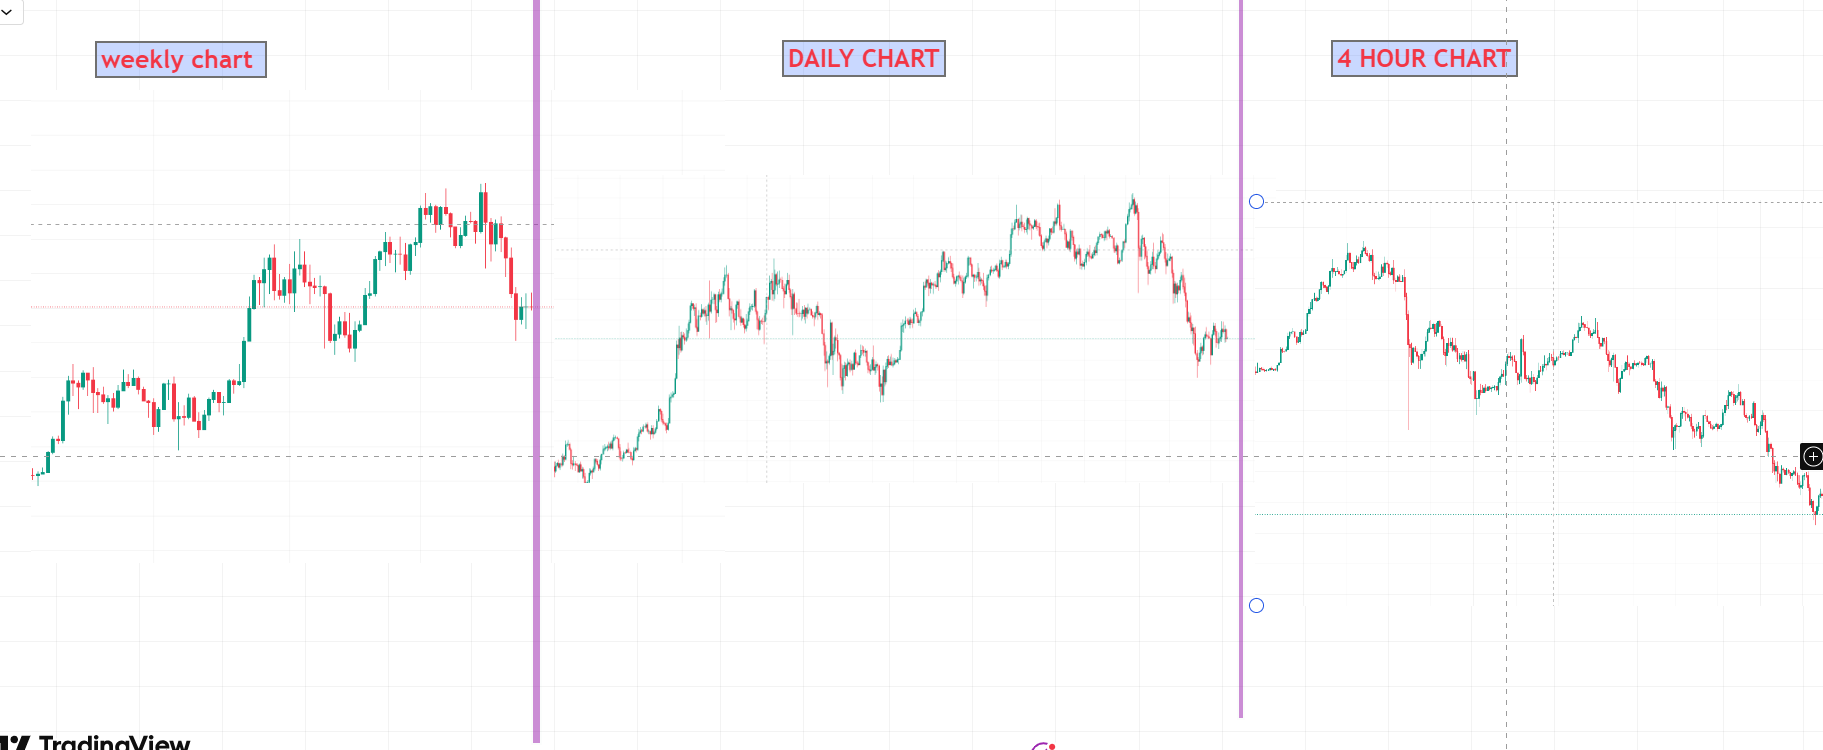
III. Trend Hierarchy & Timeframes
- Primary Trend (Long-Term): Weekly or monthly chart.
- Intermediate Trend (Medium-Term): Daily chart.
- Minor Trend (Short-Term): 1-hour or 4-hour chart.
The Golden Rule: Trade in the direction of the higher timeframe trend. This dramatically increases your probability of success.
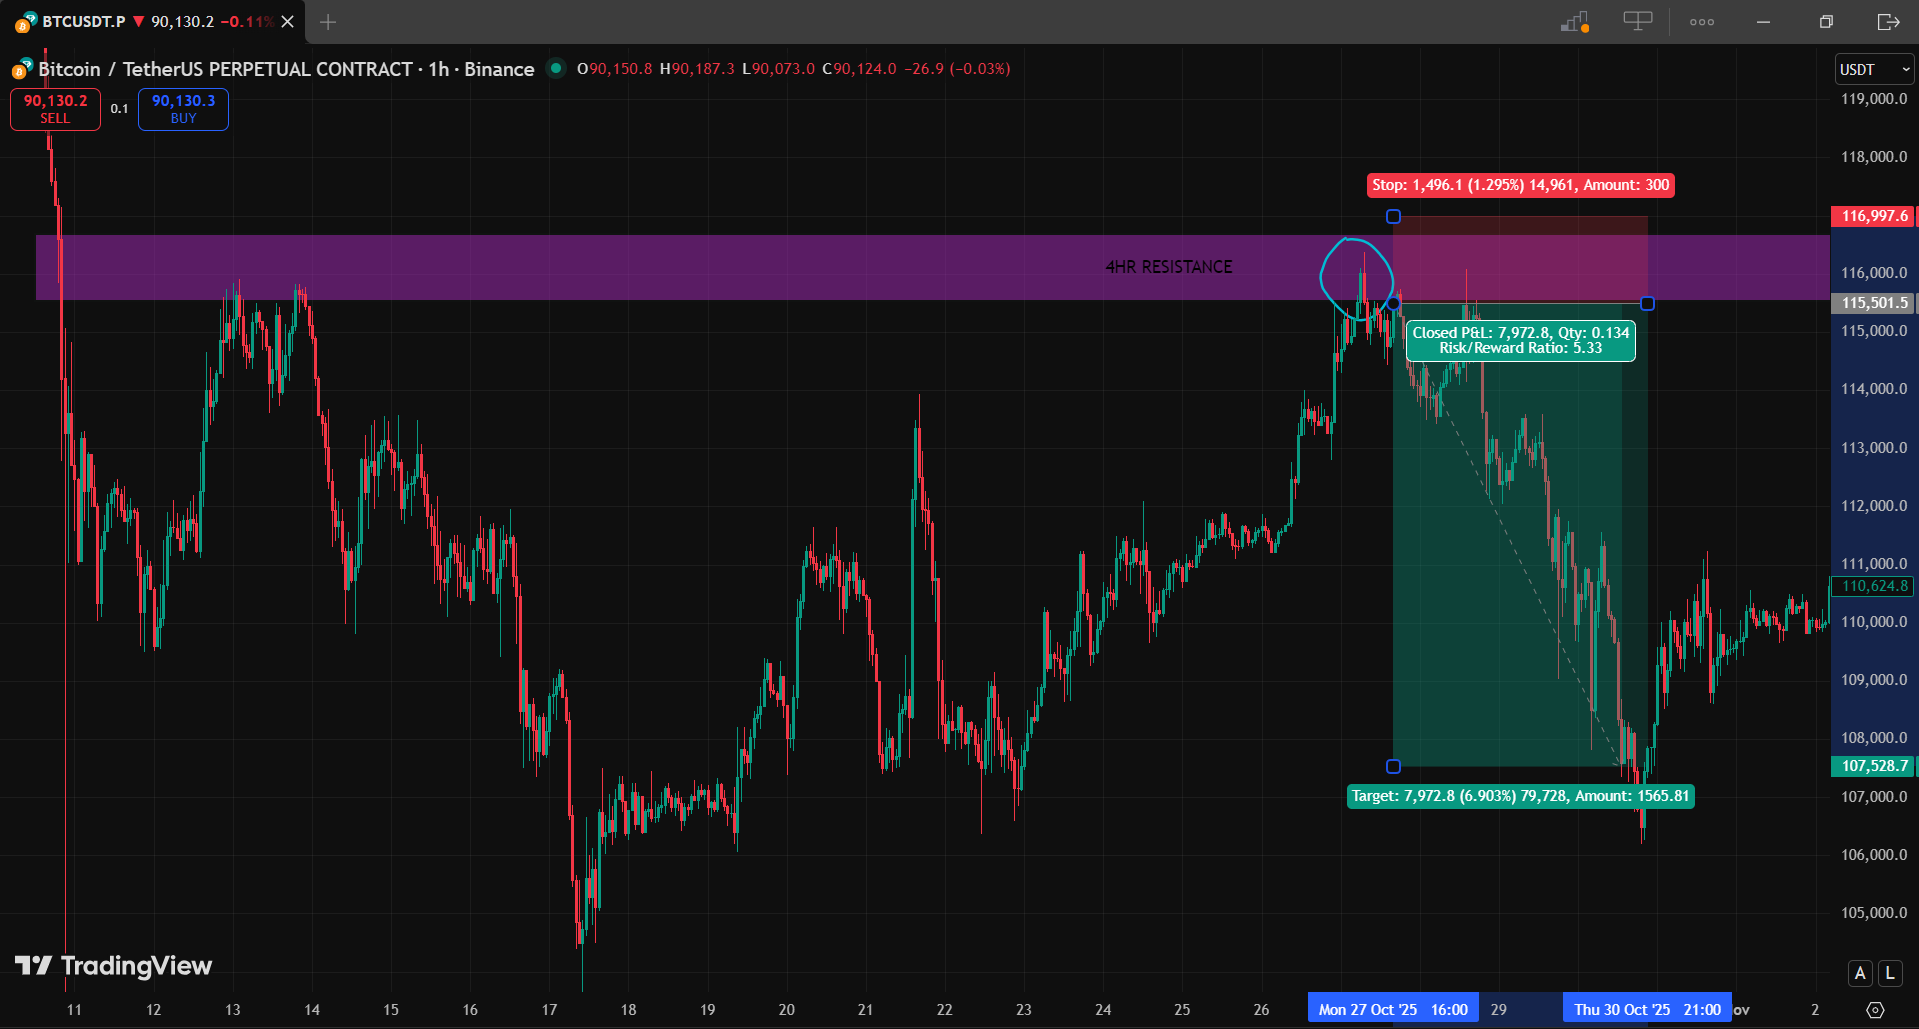
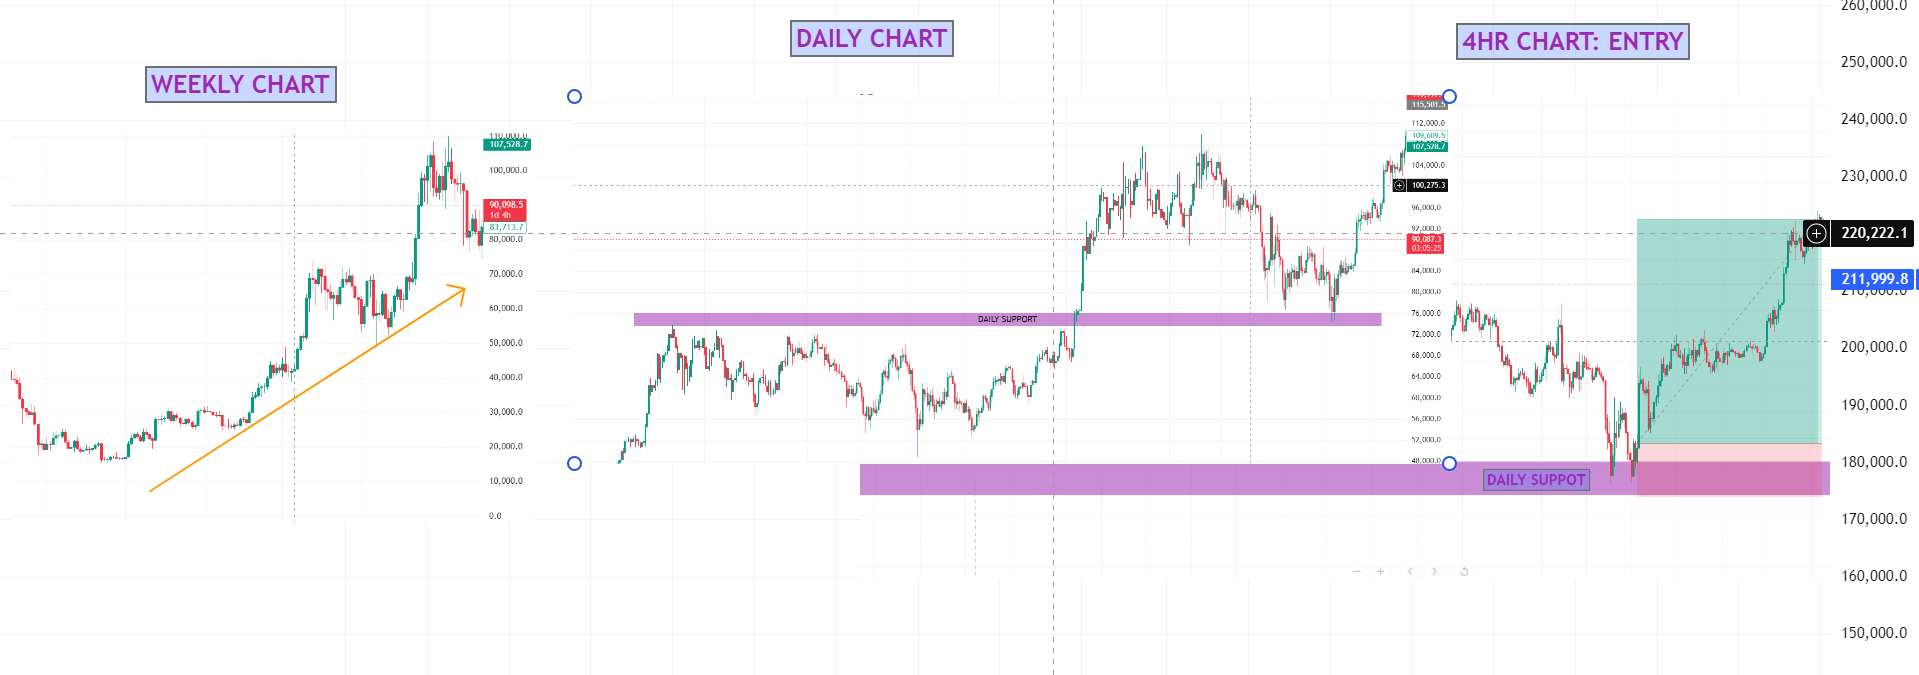
Scenario: The weekly chart is in a Bullish Trend
(Primary). The daily chart is in a Bearish pullback
(Intermediate). The 4-hour chart shows a Bullish reversal forming
(Minor).
High-Probability Trade: Look to BUY the 4-hour
bullish reversal, because it aligns with the dominant weekly
uptrend. You are "buying the dip" in a larger bull market.
IV. How Trends Change: Reversals & Breakouts
Signs of a Weakening/Breaking Trend:
-
Failure of Market Structure:
In an Uptrend: Price makes a Lower High (LH), then breaks the prior Higher Low (HL).
In a Downtrend: Price makes a Higher Low (HL), then breaks the prior Lower High (LH). - Divergence: Price makes a new high but RSI makes a lower high.
- Volume Climax: Final parabolic spike or capitulation.
- From Ranging to Trending: Breakout above resistance or breakdown below support on high volume.
V. Practical Application: A Simple Trend-Following Framework
- Zoom Out: Identify the higher timeframe trend first.
- Classify: Bullish, Bearish, or Ranging.
- Plan Your Bias: Trade only in the dominant direction.
- Enter on a Retest: Pullback to dynamic support or resistance.
Conclusion
- Bullish Trend = Buyers in control. Align with them.
- Bearish Trend = Sellers in control. Align with them.
- Ranging Market = No one in control. Trade the edges or wait.
✅ Final Key Takeaway
The trend defines control in the market. Your job is to identify who is in control — buyers, sellers, or no one — and trade accordingly.
4.3 Timeframes & Trading Styles
Key idea
Your timeframe dictates your trading style, holding period, risk tolerance, and psychological profile. Mismatch leads to failure.
In trading, timeframe and trading style are inextricably linked. Your chosen timeframe dictates the pace of your trading, your holding period, your risk tolerance, and even your psychological profile. Mismatching your personality with an incompatible timeframe is a leading cause of failure. In the 24/7 crypto market, understanding this relationship is paramount.
I. Understanding Timeframes
A timeframe (TF) is the duration of each individual candlestick or bar on a chart. It represents the aggregation of all trading activity during that period.
Common Timeframes & Their Use
| Category | Timeframes | Analogy | Primary Use |
|---|---|---|---|
| Long-Term | Monthly, Weekly | The Climate | Identifying macro trends, secular bull/bear cycles. For investors. |
| Medium-Term | Daily (1D), 4-Hour | The Seasons | Identifying the primary trading trend. For swing traders & position traders. |
| Short-Term | 1-Hour, 15-Minute | The Weather | Finding precision entries & exits. For day traders. |
| Micro-Term | 5-Minute, 1-Minute | The Wind Gusts | Executing scalps and rapid trades. For high-frequency & scalpers. |
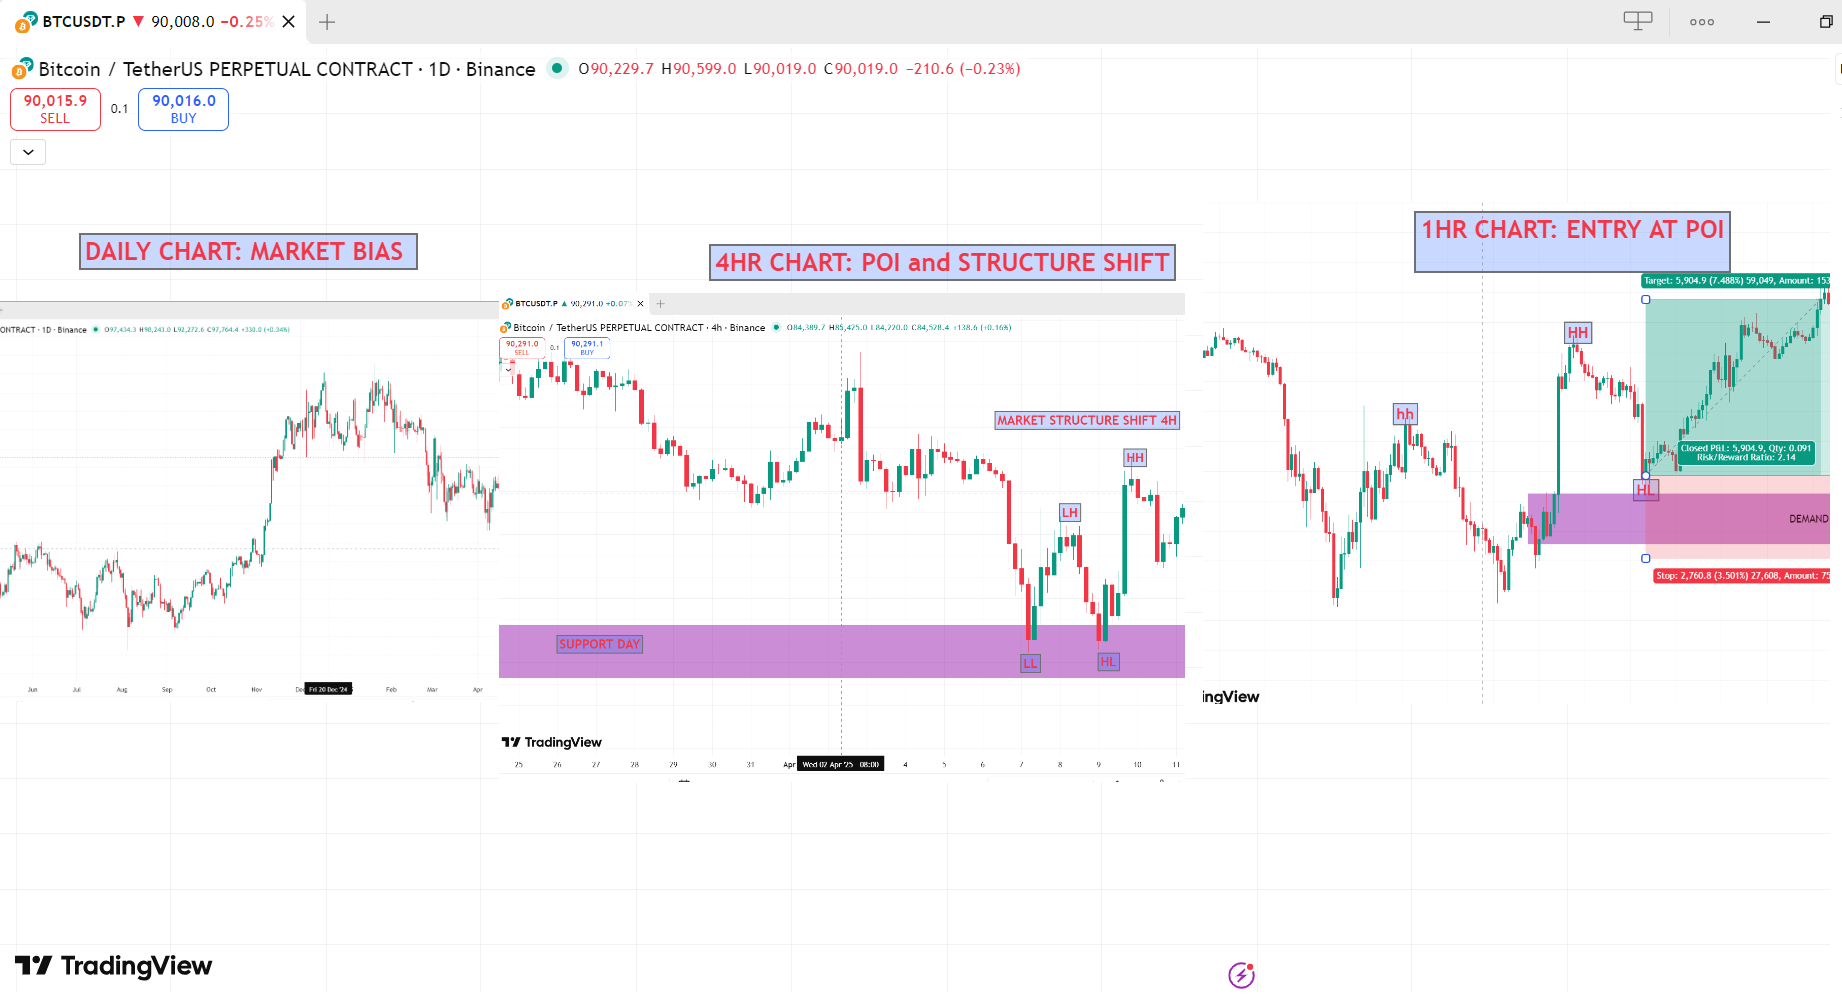
The Multi-Timeframe Analysis (MTFA) Principle
- Higher TF (HTF): Establishes the trend and bias. (e.g., Daily chart).
- Middle TF (MTF): Used for trade planning and signal generation. (e.g., 4-Hour chart).
- Lower TF (LTF): Used for precision entry and stop-loss placement. (e.g., 1-Hour or 15-Minute chart).
Example: A trader using the 4H chart as their trading chart would use the Daily as their HTF for bias and the 1H as their LTF for entry.
II. Trading Styles: From Investor to Scalper
📈 Position Trading
Timeframe: Months to years
Charts: Weekly/Monthly
Mindset: "I ignore short-term noise and
capture major trends."
Pros: Low stress, fewer trades, captures big
moves
Cons: Large drawdowns, capital tied up,
requires patience
📊 Swing Trading
Timeframe: Days to weeks
Charts: 4H/Daily
Mindset: "I capture the 'waves' within the
larger trend."
Pros: Balanced approach, more opportunities,
good risk/reward
Cons: Overnight risk, requires patience for
setups
⏱️ Day Trading
Timeframe: Minutes to hours
Charts: 15M/1H
Mindset: "I enter and exit within same day,
no overnight risk."
Pros: No overnight risk, many opportunities,
quick feedback
Cons: Stressful, requires focus, transaction
costs add up
⚡ Scalping
Timeframe: Seconds to minutes
Charts: 1M/5M/Tick
Mindset: "I profit from tiny price movements,
high volume."
Pros: Many trades, minimal exposure, compound
small gains
Cons: Extremely stressful, high commissions,
requires fast execution
III. Crypto-Specific Considerations
- 24/7 Market: Day trading and scalping are exhausting without a market close. You must self-impose strict trading hours to avoid burnout.
- High Volatility: Provides more opportunities for swing/day traders but also increases risk. Position sizing and stop-losses are non-negotiable.
- Weekend Gaps: Crypto often moves sharply on weekends when traditional markets are closed. Position and swing traders must account for this in their risk or choose to reduce exposure on weekends.
Conclusion
Your timeframe is your world, and your trading style is your identity within that world. A scalper lives in a universe of seconds and ticks; an investor observes from the mountain top, watching epochs unfold.
There is no "best" style—only the best style for you. The critical step is to consciously choose one that aligns with your life, personality, and goals, and then commit to mastering its specific tools and mindset.
In the relentless arena of crypto trading, self-awareness is your ultimate edge. Know who you are as a trader, and the charts will become far easier to read.
✅ Final Key Takeaway
Consistency in timeframe and trading style leads to consistency in results.
4.4 Price Action Basics
Key idea
Price Action is the raw, unfiltered story of supply and demand as told by candles, swings, and patterns. Master it to read the auction in real-time.
Price Action (PA) is the foundational language of the markets. It is the study of pure price movement, without the clutter of lagging indicators. It focuses on the raw, unfiltered story of supply and demand as told by the candles, swings, and patterns on the chart itself. Mastering price action is learning to read the auction process between buyers and sellers in real-time.
Core Philosophy: All market information is reflected in price. By understanding the structure and behavior of price alone, you can gauge market sentiment, identify key levels, and anticipate future moves with high probability.
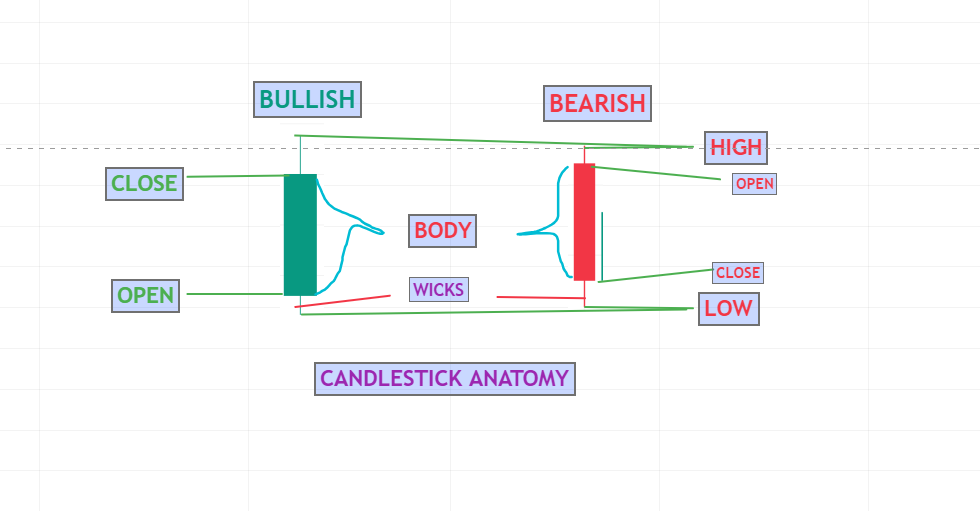
I. The Building Blocks: Candlesticks
A candlestick is the primary visual tool for price action. Each candle tells a story for its timeframe (e.g., one 1-hour candle summarizes all trading in that hour).
Anatomy of a Candlestick:
- Body: The thick part, showing the opening and closing prices.
- Green/White Bullish Candle: Close > Open. Buyers won the period.
- Red/Black Bearish Candle: Close < Open. Sellers won the period.
- Wicks/Shadows: The thin lines above and below the body, showing the high and low of the period.
- Upper Wick: Rejection at higher prices.
- Lower Wick: Rejection at lower prices.
Key Insight
- The relationship between open, close, high, and low reveals who is in control and the intensity of the battle.
- A long body with small wicks shows strong, decisive control.
- A small body with long wicks shows indecision and rejection (a fight).
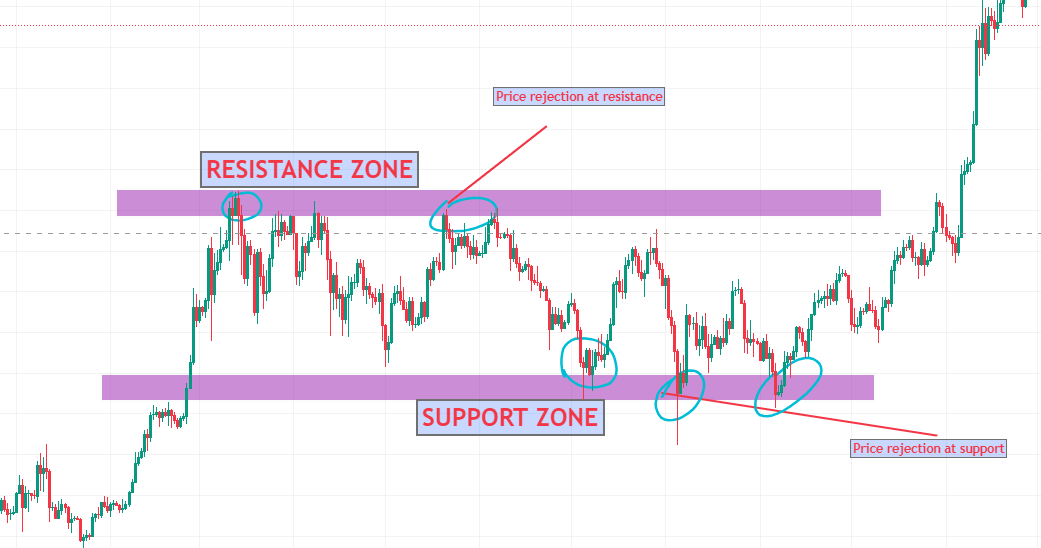
II. The First Layer: Support & Resistance (S&R)
This is the most critical price action concept. Support and Resistance are zones, not lines.
- Support: A price zone where buying pressure is historically strong enough to overcome selling pressure, causing a halt or reversal in a decline. It's a "floor."
- Forms at: Previous swing lows, consolidation areas, psychological round numbers.
- Resistance: A price zone where selling pressure is historically strong enough to overcome buying pressure, causing a halt or reversal in a rally. It's a "ceiling."
- Forms at: Previous swing highs, consolidation areas, psychological round numbers.
Key Principles:
- The More Times Tested, The Stronger It Is - A level touched 5 times is more significant than one touched once.
- Role Reversal - Broken support becomes resistance; broken resistance becomes support.
- The "Market Memory" Effect - Price remembers and reacts to historical levels.
How to Identify: Look for clusters of candlestick wicks or bodies at a similar price level where the trend has paused or reversed multiple times.
III. The Second Layer: Market Structure & Swings
Price action moves in swings (impulses) and retracements (pullbacks). The sequence of these swings defines the market structure.
- Swing High (SH): A candlestick with a high greater than those to the left and right.
- Swing Low (SL): A candlestick with a low lower than those to the left and right.
The Power of Market Structure Breaks:
- In an Uptrend: Lower High → Lower Low = Trend Broken
- In a Downtrend: Higher Low → Higher High = Trend Broken
IV. Key Price Action Patterns & What They Signal
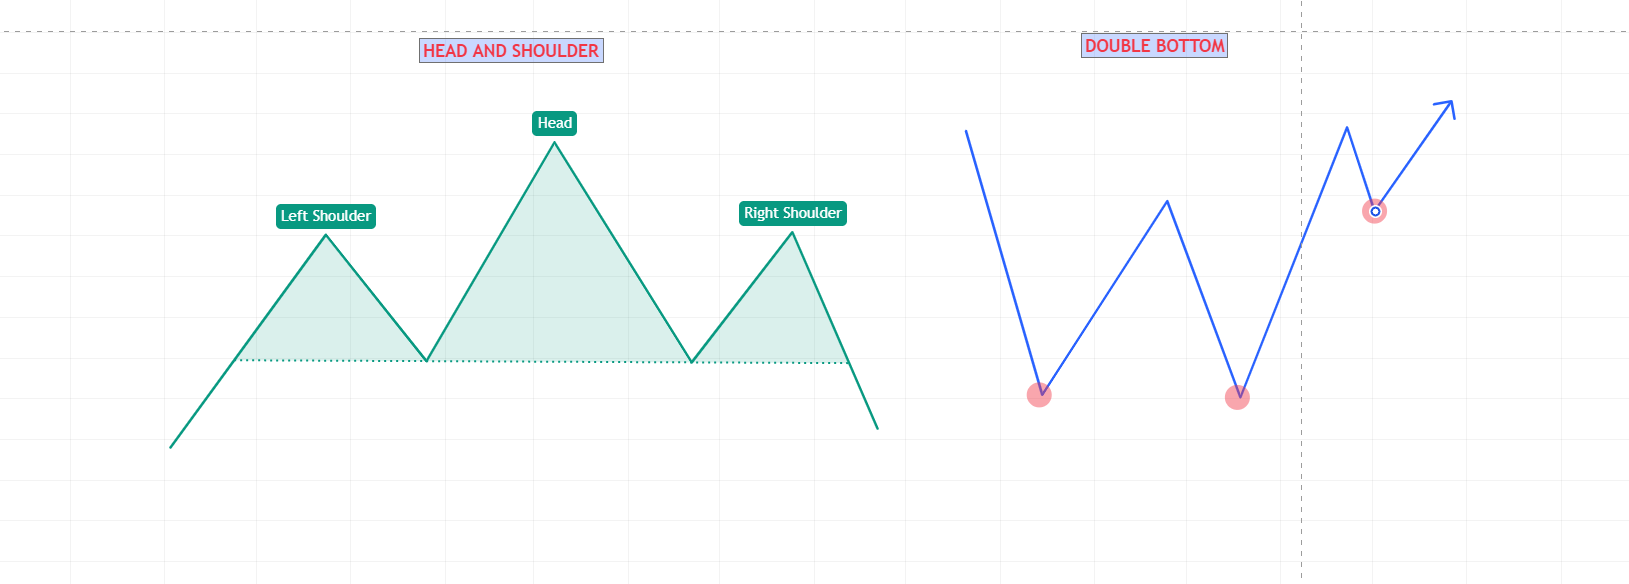
A. Reversal Patterns (Signal a potential trend change)
-
Head and Shoulders / Inverse Head and Shoulders
Three peaks with middle highest, signals trend reversal when neckline breaks.
-
Double Top / Double Bottom
Two similar peaks/troughs showing exhaustion at key levels.
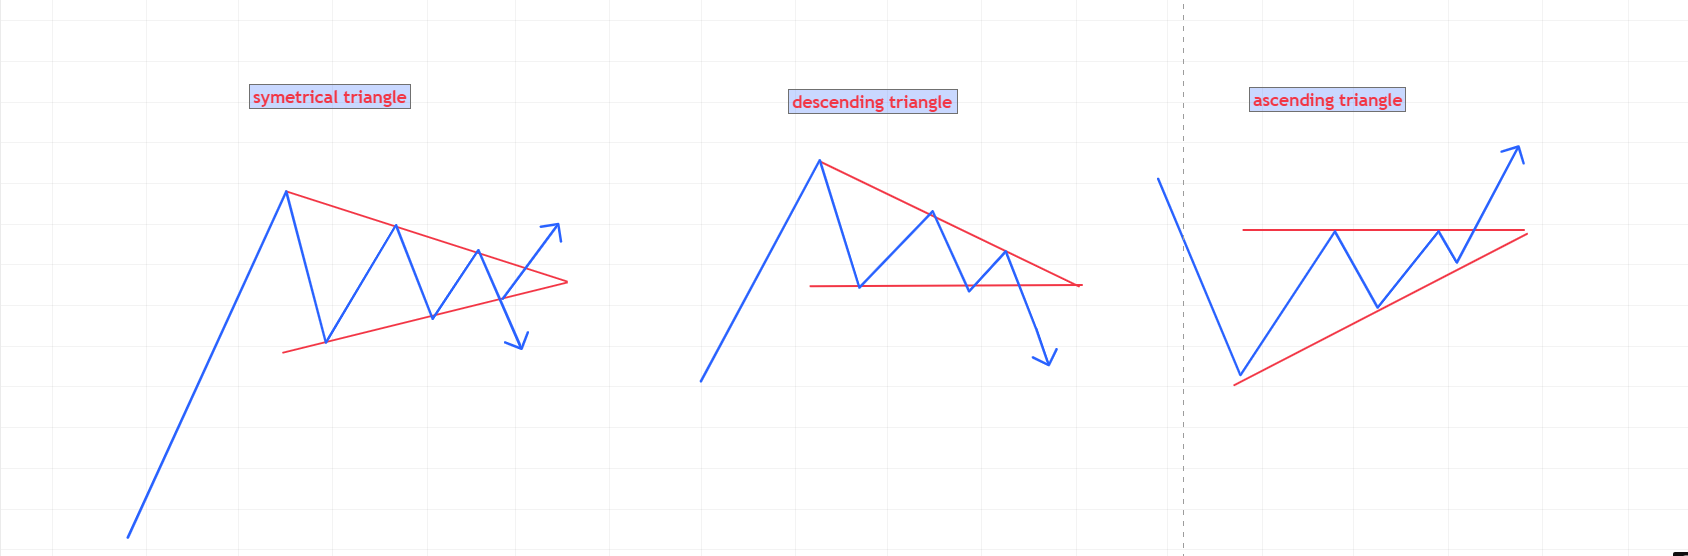
B. Continuation Patterns (Signal a pause before the trend resumes)
-
Bullish / Bearish Flag
Sharp move (flagpole) followed by consolidation, then breakout continuation.
-
Triangle Patterns (Ascending, Descending,
Symmetrical)
Price compression between converging lines, breakout indicates direction.
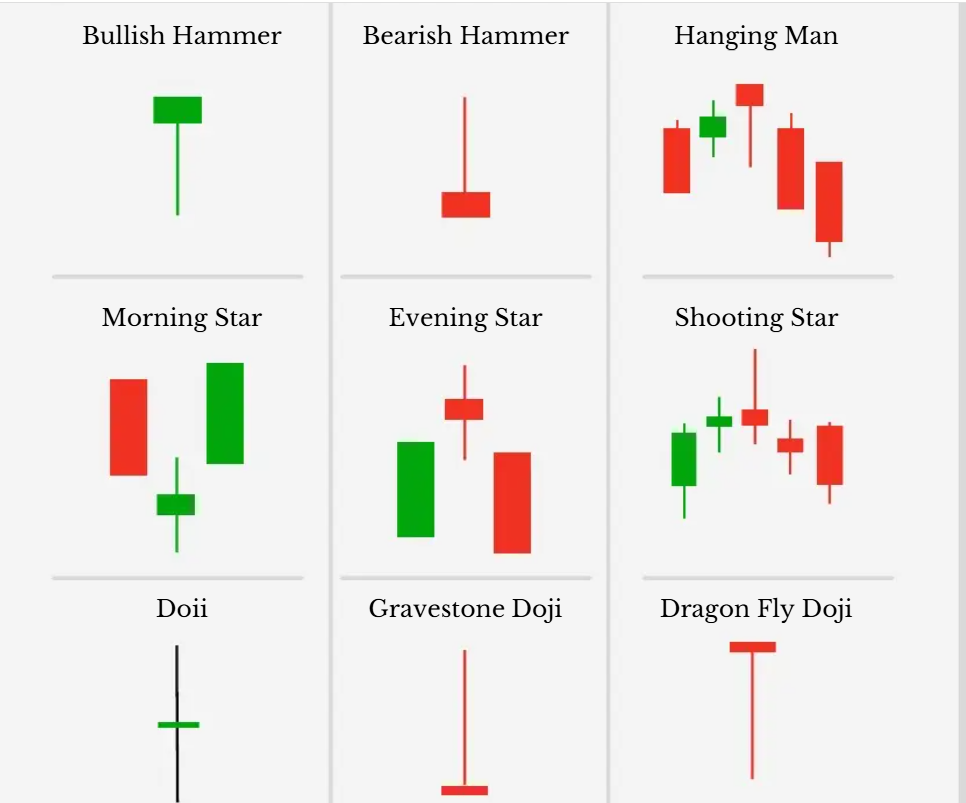
V. Key Single & Two-Bar Candlestick Patterns
-
Pin Bar (Hammer/Shooting Star)
Long wick shows strong rejection at support/resistance.
-
Engulfing Pattern
Large candle completely engulfs previous candle, showing momentum shift.
-
Inside Bar
Complete range within previous candle, signals compression before breakout.
VI. Putting It All Together: A Price Action Trading Framework
-
Identify the Context (HTF Bias)
Use higher timeframe to determine primary trend direction.
-
Mark Key S&R Zones
Draw horizontal lines at obvious support/resistance levels.
-
Wait for Price to Reach a Key Zone
Be patient - let the market come to you.
-
Look for a Price Action Signal
Watch for pin bars, engulfing patterns, or structure breaks.
-
Confirm with Volume
Signal candle should have higher-than-average volume.
-
Execute with Defined Risk
Set entry, stop-loss, and take-profit with positive risk/reward ratio.
VII. The Mindset of a Price Action Trader
-
Less is More
Clean chart with only S&R lines is more powerful than cluttered indicators.
-
Patience is a Strategy
Most time should be spent waiting for high-probability setups.
-
Price is Truth
Respect what price tells you - if setup fails, exit and reassess.
Conclusion
Price Action analysis is the art of reading the footprints of the market. It connects you directly to the auction process, allowing you to see where demand overwhelmed supply or where supply overwhelmed demand. While indicators react to past price, price action is the present reality. By learning to identify key levels, interpret candlestick patterns, and understand market structure, you develop an intuitive feel for market flow. This skill forms the bedrock upon which all other technical analysis is built. In the fast-moving crypto markets, the ability to read pure price action is often the decisive edge between reaction and anticipation.
4.5 Trend Identification Techniques
Key idea
Combine multiple techniques to filter noise and identify high-probability trend-aligned setups.
Trend identification is the cornerstone of profitable trading. In crypto markets, where trends can be explosive and volatile, accurately identifying the direction and strength of a trend separates successful traders from those who get whipsawed. This section covers the most effective techniques for identifying trends across different timeframes.
I. The Multi-Timeframe Hierarchy Approach
Before using any specific technique, establish the trend hierarchy:
- Primary Trend (Weekly/Monthly): The "tide" - determines your core bias (bullish/bearish).
- Intermediate Trend (Daily/4H): The "waves" - used for trade planning.
- Minor Trend (1H/15M): The "ripples" - used for precise entry.
Golden Rule
Always trade in the direction of the higher timeframe trend. This aligns you with the dominant market force.
II. Core Trend Identification Techniques
1. Market Structure Analysis (The Foundation)
- Definition: Purest form using only price action - sequence of HH/HL or LH/LL.
- Uptrend: HH → HL → HH → HL → HH
- Downtrend: LH → LL → LH → LL → LH
- Signal of Change: Lower High in uptrend or Higher Low in downtrend.
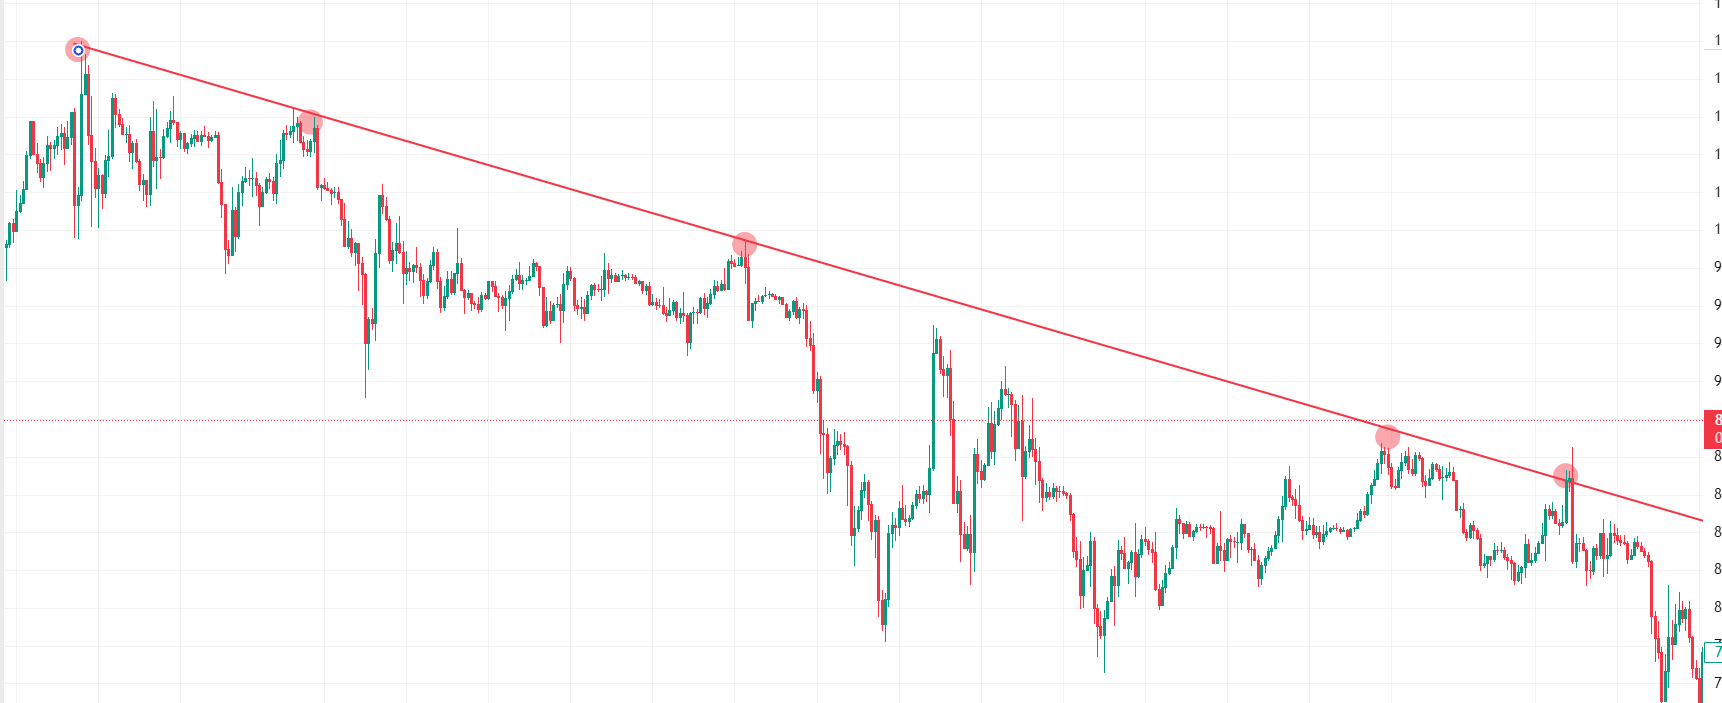
2. Trendline Analysis
- Uptrend Line: Diagonal support connecting Higher Lows
- Downtrend Line: Diagonal resistance connecting Lower Highs
- Rule: More touches = stronger trendline
- Angle matters: Steeper lines (>45°) less sustainable
3. Moving Averages (Dynamic Support/Resistance)
Key Applications:
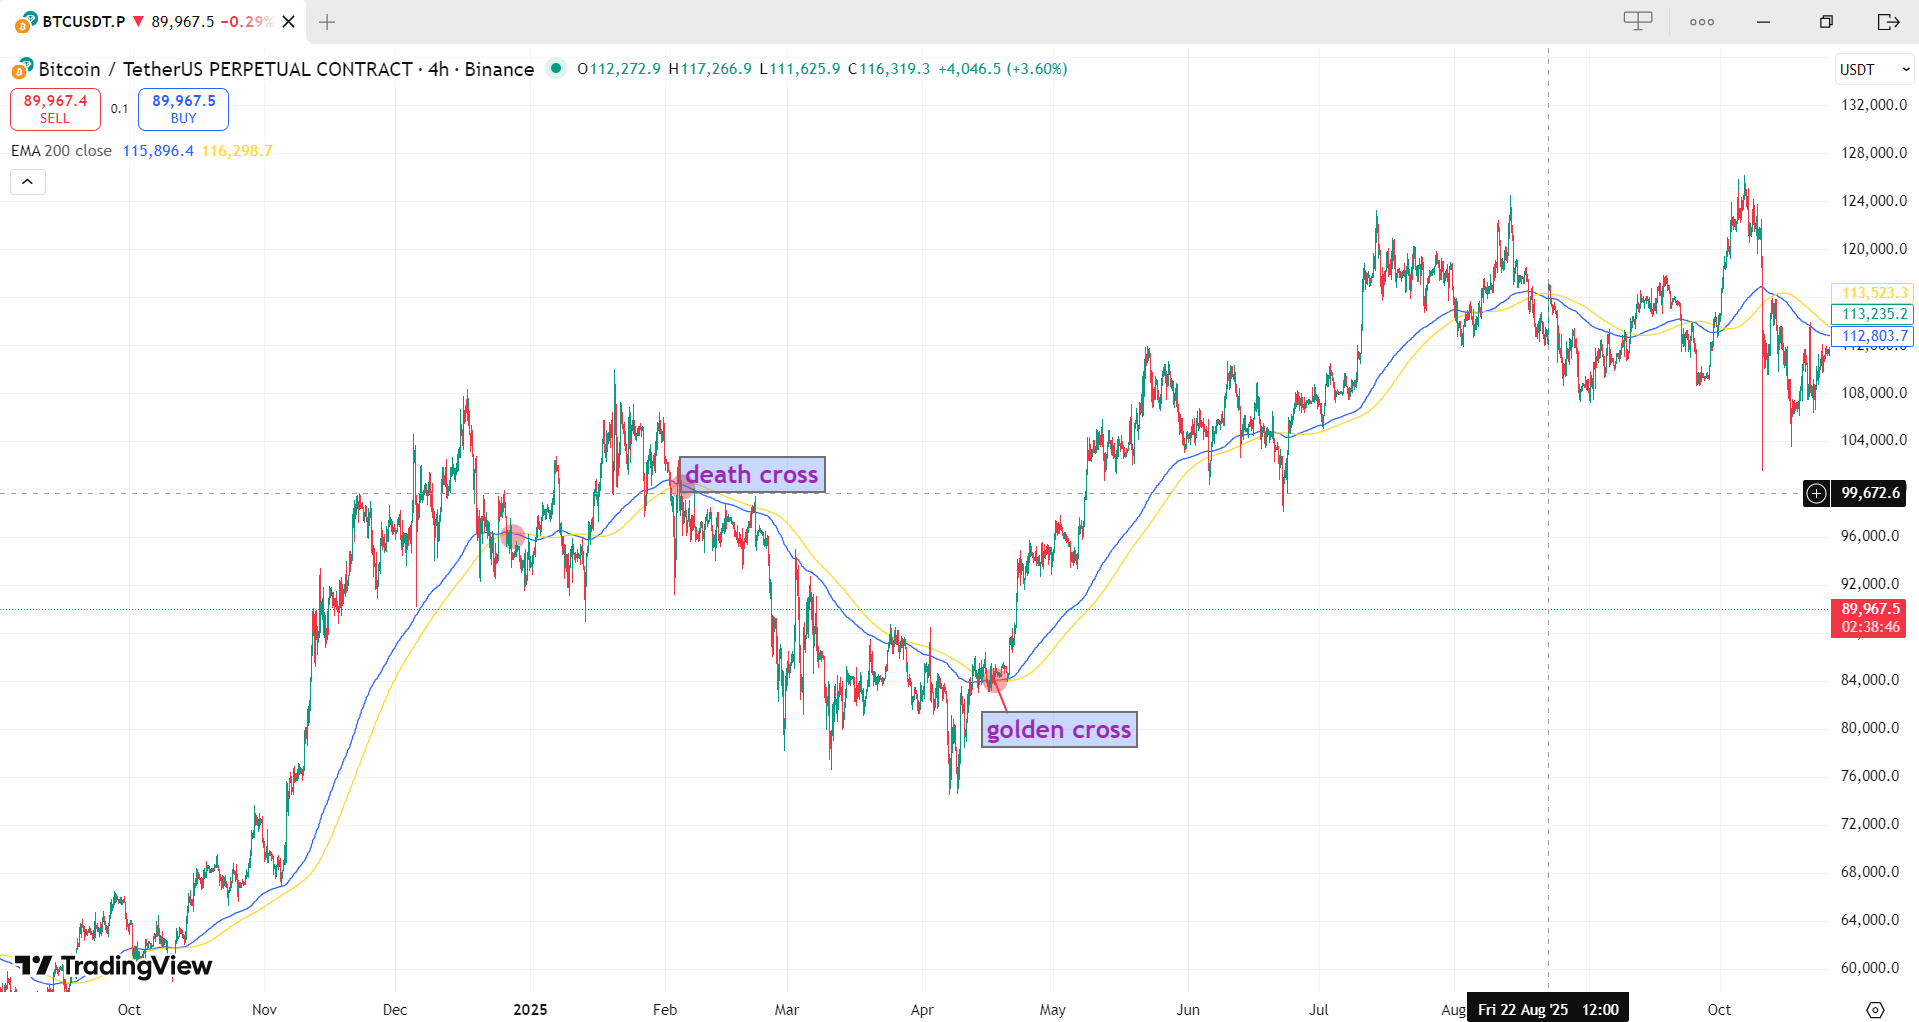
- Single MA Trend Filter: Price above EMA = bullish, below = bearish
- Golden Cross: 50 EMA crosses above 200 EMA (bullish)
- Death Cross: 50 EMA crosses below 200 EMA (bearish)
- EMA Ribbon: Multiple EMAs fanning out show strong trend
4. Average Directional Index (ADX)
- Purpose: Measures trend strength, not direction
- ADX > 25: Trend is present
- ADX > 40: Very strong trend (often precedes exhaustion)
- ADX < 20: Weak or ranging market
- +DI > -DI: Bullish trend / -DI > +DI: Bearish trend
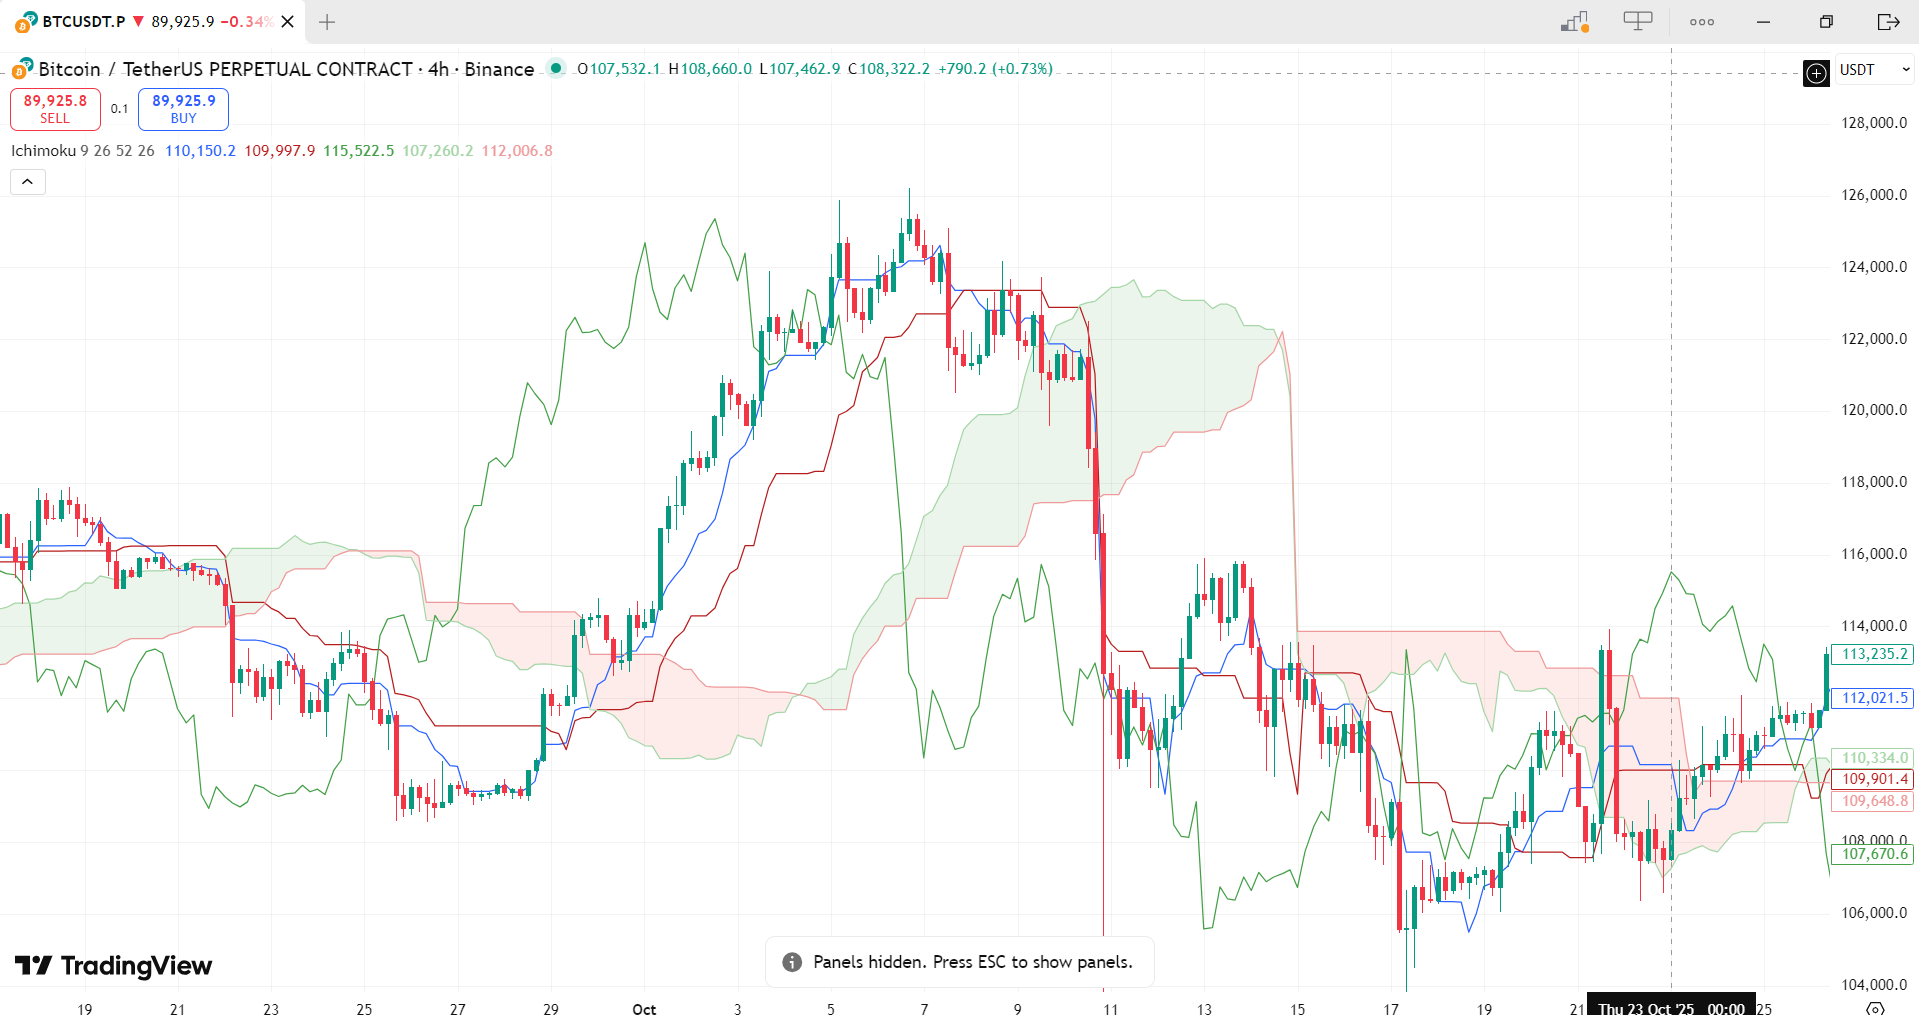
5. Ichimoku Cloud (All-in-One System)
- Price vs. Cloud: Above = bullish, Below = bearish, In = neutral
- Cloud Color: Green = bullish momentum, Red = bearish momentum
- Tenkan-sen vs. Kijun-sen: Tenkan above = bullish, below = bearish
6. Parabolic SAR (Stop and Reverse)
- Dots below price: Uptrend (hold long)
- Dots above price: Downtrend (hold short)
- Dot flip: Potential trend reversal signal
- Best For: Strong trending markets (poor in ranges)
III. Volume Confirmation - The Trend's Fuel
"Volume precedes price."
- Uptrend: Rising prices + increasing volume. Pullbacks on decreasing volume.
- Downtrend: Falling prices + increasing volume. Rallies on low volume.
- Volume Divergence: New high price + declining volume = weak trend, potential reversal.
IV. Crypto-Specific Trend Considerations
-
Bitcoin Dominance (BTC.D):
Rising = Bitcoin outperforming (risk-off). Falling = Altcoin season (risk-on).
-
On-Chain Indicators:
Realized Price vs. Market Price, MVRV Z-Score, Coin Days Destroyed.
-
Weekend Trends:
Watch for trend initiation/acceleration when traditional markets closed.
V. Practical Framework: Combining Techniques
Use this checklist for robust trend identification:
Step 1: Determine Primary Trend (Weekly Chart)
- Market Structure: HH/HL or LH/LL?
- Moving Averages: Price above/below 200 EMA?
- Ichimoku: Price above/below cloud?
- Volume Trend: Increasing with trend direction?
Step 2: Confirm Intermediate Trend (Daily Chart)
- Market Structure: Aligns with weekly?
- Trendlines: Valid trendline with multiple touches?
- ADX: >25 confirming trend strength?
- EMA Alignment: Ordered bullish/bearish?
Step 3: Identify Entry (4H/1H Chart)
- Pullback to Support/Resistance in trend direction?
- Confluence: Multiple techniques agreeing?
- Volume: Supportive on entry candle?
VII. Trend Identification Cheat Sheet
| Technique | Bullish Signal | Bearish Signal | Best For |
|---|---|---|---|
| Market Structure | HH & HL | LH & LL | All timeframes, pure PA |
| Trendlines | Price respects rising support | Price respects falling resistance | Visual clarity |
| EMA Alignment | Price > 50 EMA > 200 EMA | Price < 50 EMA < 200 EMA | Dynamic support/resistance |
| ADX | +DI > -DI & ADX > 25 | -DI > +DI & ADX > 25 | Filtering choppy markets |
| Ichimoku | Price above green cloud | Price below red cloud | Comprehensive view |
| Volume | Rising on advances, falling on pullbacks | Rising on declines, falling on rallies | Confirming strength |
Conclusion
Trend identification is both a science and an art. The science lies in objectively applying techniques like market structure and indicator readings. The art lies in interpreting the weight of evidence and understanding market context. In crypto's volatile environment, trends can emerge and reverse with stunning speed. The disciplined trader uses a multi-technique, multi-timeframe approach to filter out noise and focus only on high-probability, trend-aligned setups. Remember: The trend is your friend until the end when it bends. Your job is to ride the trend while it's valid and exit gracefully when the evidence shows it's breaking down. Master these techniques, and you'll develop the ability to see not just where price is, but more importantly, where it's likely going - the ultimate edge in cryptocurrency trading.
Module 4: Workshop & Exam
Test your understanding of Technical Analysis with this 15-question timed exam.
🛠️ Practical Workshop
TASK 1: Identify Current Trend
Pick any crypto pair. Analyze weekly/daily chart. Is it bullish, bearish, or ranging? List the evidence.
TASK 2: Mark S&R Zones
On a 4H chart, identify 3 support and 3 resistance levels. Note which are strongest (most touches).
TASK 3: Plan a PA Trade
Find a setup where price reaches a key level and forms a candlestick signal. Plan entry, stop, target.
📋 15-Question Exam
⏳ Time Left: 15:00
Student Notes (Real)
Real notes from students who completed this module. Use them to reinforce your learning.
✅ What I understood
"The trend is everything. I used to buy dips in downtrends and wonder why I lost. Now I check higher timeframe first and only trade with the trend."
— Student note (placeholder)
⚠️ What I struggled with
"Support and resistance zones vs lines. Now I understand they're areas where price reacts, not exact lines. Role reversal was a game-changer."
— Student note (placeholder)
🎯 My next step
"I'll practice multi-timeframe analysis on 10 charts daily. Mark S/R, identify trend, look for PA signals. Journal every setup."
— Student note (placeholder)
Want to submit your note?
Use a form page (example: support.html) to collect feedback. Avoid fake reviews. Publish only verified notes with consent.
Module 4 Complete
You now understand Technical Analysis fundamentals: market trends, price action, support/resistance, candlestick patterns, and multi-timeframe analysis. You're ready to analyze charts like a pro.
Reminder: Education only. No guaranteed profits.